
Roshan Dsouza, Hrebesh Subhash, Kai Neuhaus, Paul M. McNamara, Josh Hogan, Carol Wilson, Martin J. Leahy. Feasibility study of phase-sensitive imaging based on multiple reference optical coherence tomography[J]. Chinese Optics Letters, 2017, 15(9): 090007
- Chinese Optics Letters
- Vol. 15, Issue 9, 090007 (2017)
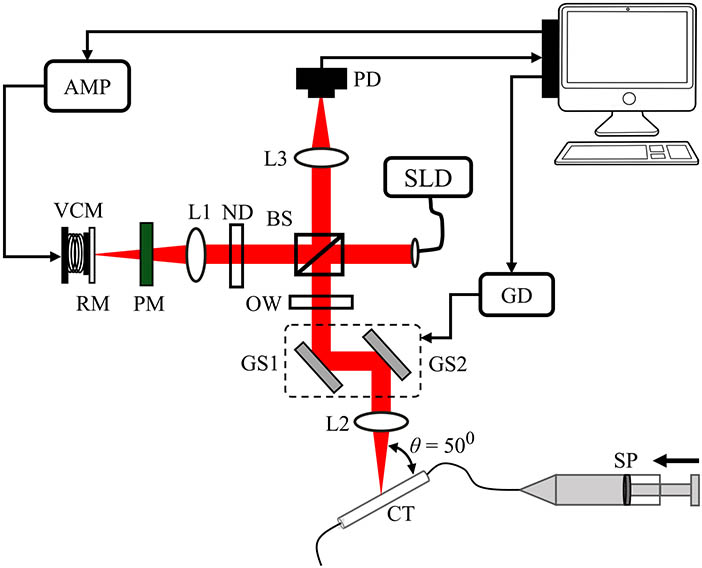
Fig. 1. Experimental setup of a phase-sensitive MR-OCT system based on a bulk optics configuration. L1–L4, lenses; BS, beam splitter; ND, neutral density filter; AMP, VCM amplifier; OW; optical window; GD, galvo driver; CT, capillary tube; SP, syringe pump.
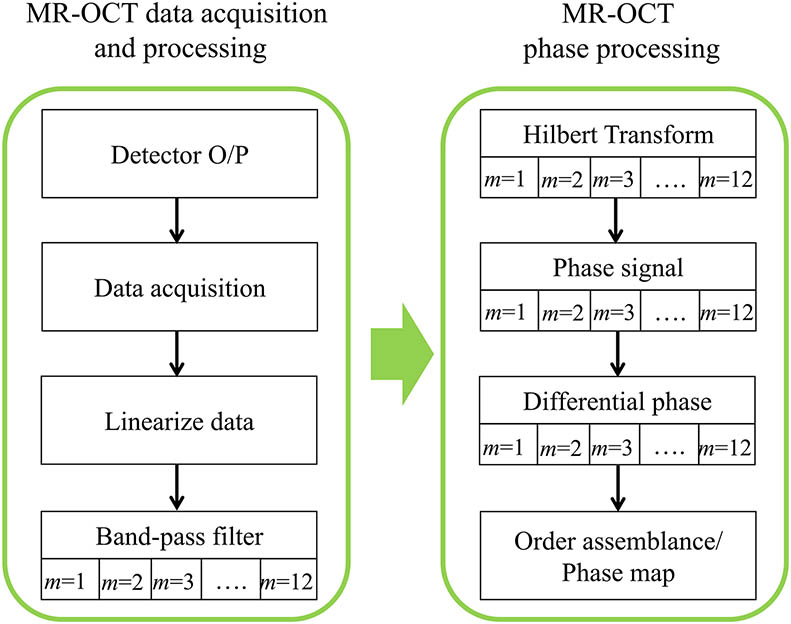
Fig. 2. Flow chart for MR-OCT phase data processing. Signal processing includes a band-pass filter for each order of reflection
Fig. 3. Structural and phase difference images of a 300 μm capillary tube filled with 5% intralipid solution with a Doppler angle of 50°. (a) The successive structural images corresponding to twelve orders of reflection. The scan range for the first order was
Fig. 4. Measured system sensitivity of the MR-OCT system for twelve orders of reflection. The measurement was recorded with a mirror as a sample and by placing a neutral density filter (
Fig. 5. Determination of phase sensitivity calculating the standard deviation on the phase fluctuations. (a) The phase fluctuations between the sequential A lines of the first-order reflection. (b) The calculated phase sensitivity of the MR-OCT system for twelve orders of reflection. The phase difference was recorded using a static mirror as the sample and by placing a neutral density filter (
Fig. 6. MR-OCT phase difference images of 5% intralipid solution flowing through a capillary tube measured at various flow rates with a Doppler angle of 50°. (a) Structural image of a 300 μm capillary tube filled with intralipid solution. (b) Phase difference image at 0 μm/s and (c)–(h) phase difference images at 50, 100, 150, 200, 250, and 300 μm/s. PW, phase wrap. Scale bar: 250 μm.
Fig. 7. Validation of the phase measurements that are shown in Fig. 6 . (a) Phase profile along the center of the capillary tube (horizontal) and the corresponding second-order polynomial fit at each flow rate. (b) Comparison of measured and pump velocity.
Fig. 8. In vivo chicken embryo imaging with phase-sensitive MR-OCT system. (a) Structural image of a chicken embryo vessel and (b) the corresponding phase difference image. (c) The A line and phase profile taken at two different positions P1 and P2. Scale bar: 500 μm.

Set citation alerts for the article
Please enter your email address
© Copyright 2018-2021 | Chinese Laser Press. All Rights Reserved 沪ICP备15018463号-20