Roshan Dsouza, Hrebesh Subhash, Kai Neuhaus, Paul M. McNamara, Josh Hogan, Carol Wilson, Martin J. Leahy, "Feasibility study of phase-sensitive imaging based on multiple reference optical coherence tomography," Chin. Opt. Lett. 15, 090007 (2017)
Copy Citation Text
Multiple reference optical coherence tomography (MR-OCT) is a recently developed, low-cost and compact time-domain OCT solution for primary care and consumer level applications. A combination of a voice coil actuator and a partial mirror (PM) extends the scan range for imaging depths of approximately 1 mm in biological samples. Our previous research on MR-OCT is based only on intensity information obtained from the depth-resolved interference signal. In this Letter, we extract the phase information from the MR-OCT signal and, hence, provide an additional contrast modality. The phase sensitivity of the system is measured to be approximately 0.2 and 1.5 rad for the first and twelfth orders of reflection when using a mirror as the sample. This Letter describes first results of phase-sensitive data measured on a phantom obtained with MR-OCT. Data from a chick embryo chorioallantoic membrane (CAM) is used to demonstrate the feasibility of MR-OCT for in vivo phase-sensitive imaging.
Optical coherence tomography (OCT) is a powerful imaging modality and has gained rapid acceptance by the medical community[1]. OCT provides high-resolution depth-resolved structural images by measuring the interference signal amplitude based on low coherence interferometry. OCT systems can be implemented in the time domain (TD) or Fourier domain (FD). In TD-OCT, the path length of the reference mirror (RM) is varied by mechanically scanning the RM[2]. FD-OCT differs from TD-OCT, where the depth scan is obtained by sweeping the spectrum of the input light using a swept source OCT (SS-OCT)[3] or through the utilization of a high-speed spectrometer and detector array in a spectral domain (SD) system[4]. Several methods, such as phase-sensitive OCT, polarization-sensitive OCT, spectroscopic OCT, and angiography have been developed to extract the functional information from the skin tissue and thereby provide a contrast mechanism between static and dynamic regions[5].
Recent trends in OCT have focused on developing a low-cost, compact OCT system and ergonomic probe design for a wide range of primary and point-of-care applications. Compact and low-cost solutions for OCT scanners have been reported by several groups for use in primary care applications[6–9]. OCT systems based on photonic integrated circuits (PICs) are an emerging technology and have the potential to be low cost and compact. Partially equipped OCT systems based on the PIC design (i.e. without lateral scanning and without an on-board light source) have been demonstrated in both the SD[10] and the SS[11–13] domain. The reported studies show promising results and can potentially be well-suited for applications in low-resource settings. Pande et al. demonstrated a low-cost hand-held OCT system based on the principle of linear OCT[14]. The results from this study showed potential applications in imaging the tympanic membrane and quality inspection of nondestructive samples. Osawa et al.[15] reported a low-cost TD-OCT system constructed from compact disc pickup head (PUH) components. This study used a low-cost laser diode as an optical source, and the imaging was performed by scanning the focal point of the sample beam. The axial scan rate was 130 Hz, which provided a scan range of about 600 μm.
In general, phase-sensitive OCT systems facilitate detection of flow information by extracting the phase information from the interference signal. For accurate measurement of the velocity component, phase-sensitive OCT requires high phase stability and high system sensitivity. The first demonstration of two-dimensional (2D) flow extraction was reported on a TD-OCT system by Chen et al. The authors reported the extraction of flow information via a spectrograph method[16,17] and later demonstrated the phase resolved method[18–20]. The advent of FD-OCT and its application to phase-sensitive measurements has caused the gradual replacement of the TD-OCT method. This was mainly due to the increased scan rates and high phase stability achieved by FD-OCT systems.
Sign up for Chinese Optics Letters TOC. Get the latest issue of Chinese Optics Letters delivered right to you!Sign up now
Our group, in collaboration with Compact Imaging, Inc., has recently pioneered another variant of OCT for low-cost applications[21–23]. The new system is based on the concept of TD-OCT and enhances the axial scan range using a partial mirror (PM) in front of the RM of the interferometer. The repeated recirculation of light creates multiple optical delays, generating multiple reference (MR) signals that allow multiple scan ranges for deeper axial imaging. The performance of a free-space MR-OCT system has been previously demonstrated by imaging the in vivo fingertip and forearm[24] and for nondestructive testing applications[25,26]. In addition, we have recently reported the feasibility of building a miniature configuration of an MR-OCT using off-the-shelf micro-optical components[27]. The reported micro-optics system was 10 times smaller than the bulk optics system, and the preliminary results showed promising imaging capability. In this Letter, a phase-based processing method has been implemented to extract the functional information provided by the MR-OCT system. The results presented will demonstrate the feasibility of a phase-sensitive MR-OCT system by detecting the phase change in a calibrated flow phantom. Furthermore, data from a chorioallantoic membrane (CAM) will be shown to demonstrate the feasibility of phase-sensitive MR-OCT for in vivo imaging.
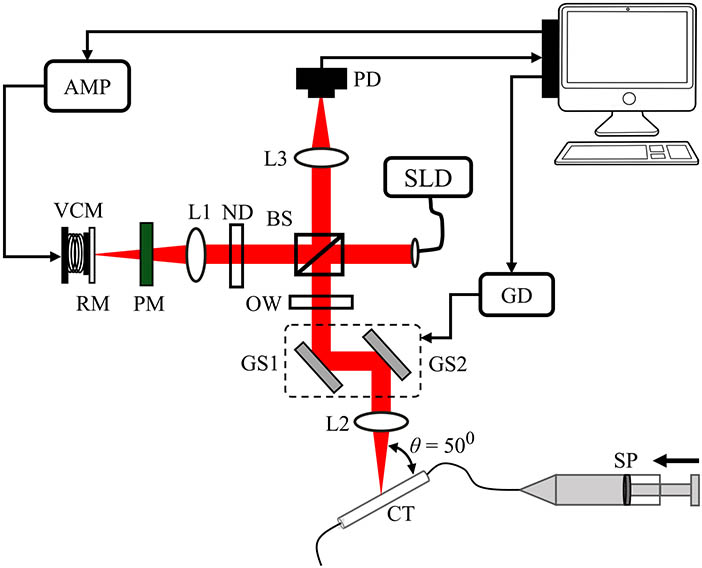
Figure 1 shows a schematic diagram of the MR-OCT system used for the phase-sensitive study. The system described herein is based on a free-space Michelson interferometer and uses a voice coil motor (VCM) extracted from a CD-R/RW/DVD-ROM drive unit (CRX330E-DR, Sony) as a delay line. More details on the system design, MR-OCT concept, and characterization can be found in Ref. [28].
Figure 1.Experimental setup of a phase-sensitive MR-OCT system based on a bulk optics configuration. L1–L4, lenses; BS, beam splitter; ND, neutral density filter; AMP, VCM amplifier; OW; optical window; GD, galvo driver; CT, capillary tube; SP, syringe pump.
A broadband superluminescent diode (SLD) with a center wavelength of 1310 nm and a bandwidth of 56 nm was coupled into the interferometer. The collimated beam is then split ∶ into the sample and reference arm. The RM was attached to a miniature VCM actuator, and then a PM with 20% transmission efficiency was placed at a small distance (μ) in front of the RM. The VCM was driven at a frequency of 600 Hz, achieving a scan range of μ. The sample arm consisted of a pair of mirrors mounted onto galvanometer scanners (GSs), an optical window for compensating the dispersion caused by the PM, and an objective lens with a focal length of 50 mm. During measurement, the irradiation power on the sample surface was around 4 mW. The measured axial and lateral resolutions of the system were and μ in air, respectively. The light returning from the sample and reference arm is then detected by an InGaAs photodetector (PD, 2053FS, Newport). The analog OCT signal was digitized using a 14 bit analog/digital (A/D) card (AlazarTech, ATS9440) and was recorded on a workstation (Dell Precision, Model-T7500 and Processor: Intel Xeon E5645 @ 2.40 GHz) for further processing.
The recorded MR-OCT signal contains interference signals from multiple-order reflections (and hence, multiple depths). The beat frequency for each order changes according to , with the frequency of the first-order reflection, and for each higher order of reflection. The beat frequency of the interference signal is then used to separate each order by filtering with multiple band-pass filters. The reconstruction process can be separated into pre- and post-processing. The pre-processing comprises the removal of the direct current (DC), phase linearization, separation of orders by digital filtering, envelope detection, resampling, and merging the signals for each order into a single A line. A more detailed explanation of the image processing can be found in Ref. [28]. The post-processing is then used to extract the phase data from one or multiple order of reflections. The principle of calculating the phase and measure flow is described by Zhao et al.[18,20].
The phase () information of the interference signal is determined from the complex signal [], resulting from the Hilbert transform for each A line and time :
The phase difference () is then calculated between adjacent A lines and of a sequence of A lines () for each order of reflection :
The flow chart in Fig. 2 outlines the overall steps of the processing including pre- and post-processing.
Figure 2.Flow chart for MR-OCT phase data processing. Signal processing includes a band-pass filter for each order of reflection . The phase signal is derived from the complex signal by use of a Hilbert transformation.
The phase difference between the two adjacent A lines should be close to zero if the scattering particle does not move during the scan, and any non-zero phase value will correspond to a moving scatterer. The processed phase and structural-order scan segments are then arranged according to their actual depth position to form a depth-resolved MR-OCT scan , where corresponds to the scan range of the VCM (μ) and corresponds to the separation between the PM and the scanning RM (μ).
In this work, we have used the first twelve orders to reconstruct each A line, which corresponds to a total scan range of . Figure 3 shows the structural and phase difference image obtained from the processing steps as previously explained. The sample is a capillary tube with an internal diameter of 300 μm, filled with a 5% intralipid solution. For comparison, Fig. 3(a) shows the structural images of the first twelve orders, and Fig. 3(b) is the recombined MR-OCT image. Figure 3(c) shows the corresponding phase difference image for each order, and Fig. 3(d) shows the recombined phase.
Figure 3.Structural and phase difference images of a 300 μm capillary tube filled with 5% intralipid solution with a Doppler angle of 50°. (a) The successive structural images corresponding to twelve orders of reflection. The scan range for the first order was μ and the twelfth order was μ. (b) Stitched image of all twelve orders shown in (a). (c) The corresponding phase difference images of all orders shown in (a) and (d) the stitched phase difference image. Scale bar: 250 μm.
The sensitivity of the MR-OCT system was measured using a mirror and a calibrated attenuator (optical density, ) in the sample arm. The detector’s amplifier gain was reduced until the output signal was below the saturation limit. During measurement, the irradiation power on the sample surface (sample mirror) was about 210 μW. To measure the sensitivity for each order, the sample mirror was stepped away from the system to a depth of 1.5 mm. Figure 4 shows the measured sensitivity for the twelve orders of reflection without any averaging. The experimental data confirm that each order has a signal roll-off of approximately 1.3 dB per order.
Figure 4.Measured system sensitivity of the MR-OCT system for twelve orders of reflection. The measurement was recorded with a mirror as a sample and by placing a neutral density filter () in the sample arm.
The phase sensitivity of the system was measured with the same arrangement as the sensitivity measurement, which included the sample mirror and the attenuator (). During acquisition, the galvo control was turned on, and a total of 2048 A lines were acquired at the same lateral position (M scans). The phase of the interference signal was obtained by use of a Hilbert transform and then by measuring the phase change between sequential A lines. The phase-sensitivity () metric is defined as the standard deviation of the phase variance. Consequently, a larger value for the standard deviation of the phase variance means a reduced phase sensitivity or a minimum resolvable velocity. Figure 5(a) shows the phase fluctuations plotted for the first order of reflection. Figure 5(b) shows the phase sensitivity for the twelve orders of reflection.
Figure 5.Determination of phase sensitivity calculating the standard deviation on the phase fluctuations. (a) The phase fluctuations between the sequential A lines of the first-order reflection. (b) The calculated phase sensitivity of the MR-OCT system for twelve orders of reflection. The phase difference was recorded using a static mirror as the sample and by placing a neutral density filter () in the sample arm path.
By knowing the phase sensitivity of the system, the minimum resolvable velocity in a sample can be estimated based on the relation[29], where is the center wavelength, is a time difference between sequential A lines, and corresponds to the minimum resolvable phase difference for the th order of reflection. The calculated maximum resolvable velocity for the described system was about 200 μm/s. The phase sensitivity of the MR-OCT system decreases with an increasing order of reflection, and, hence, the minimum resolvable velocity for each order will also decrease. The calculated minimum resolvable velocity for the first- and twelfth-order’s reflection was about 13 and 93 μm/s, respectively.
To evaluate the performance of the phase-sensitive MR-OCT system, a set of flow phantom experiments were carried out with a capillary tube having an internal diameter of 300 μm. The flow phantom was filled with 5% intralipid solution, and the flow speed was controlled by a syringe pump (PHD2000, Harvard Apparatus). The recorded data contains 300 A lines, covering a lateral region of about 1 mm. At each step of the lateral scan, a total of eight A lines (M scans) were acquired. The measured phase difference between eight A lines is then averaged to form a phase difference image.
To quantify the ability of the phase-sensitive MR-OCT system to measure flow velocity, the pump was set to six different velocities: 50, 100, 150, 200, 250, and 300 μm/s. During measurement, the angle between the capillary tube and imaging beam was set to 50° (see Fig. 1). Figure 6(a) shows the structural image of the flow phantom, and Fig. 6(b) shows the phase difference image at a setting of 0 μm/s velocity. With the pump setting at 0 μm/s, a small phase difference was observed, which could be caused by gravitational pull. Figures 6(c)–6(h) show the phase difference image of the flow phantom pumped at velocities 50, 100, 150, 200, 250, and 300 μm/s. As the velocity rate is increased, the color of the phase data changes from cyan to blue (representing phase values from to ). The phase wraps occurs () at flow velocities larger than 200 μm/s, which can be seen as rings or arcs in Fig. 6(g) and 6(h).
Figure 6.MR-OCT phase difference images of 5% intralipid solution flowing through a capillary tube measured at various flow rates with a Doppler angle of 50°. (a) Structural image of a 300 μm capillary tube filled with intralipid solution. (b) Phase difference image at 0 μm/s and (c)–(h) phase difference images at 50, 100, 150, 200, 250, and 300 μm/s. PW, phase wrap. Scale bar: 250 μm.
Figure 7(a) shows the measured phase profile along the center (horizontal) of the capillary tube and a corresponding second-order polynomial fit at each flow rate. Figure 7(b) shows a comparison between the measured velocity using the phase-sensitive MR-OCT system and the mean velocity from the syringe pump. The average flow velocity was calculated based on Eq. (5) by averaging the phase difference data ()[30]; where is the center wavelength, is a time difference between sequential A lines, corresponds to the phase change between sequential A lines, is the angle between the direction of flow and the imaging beam (also called a Doppler angle), and corresponds to the index of refraction. The refractive index of the 5% intralipid solution was about 1.33[31].
Figure 7.Validation of the phase measurements that are shown in Fig. 6. (a) Phase profile along the center of the capillary tube (horizontal) and the corresponding second-order polynomial fit at each flow rate. (b) Comparison of measured and pump velocity.
To test the feasibility of the phase-sensitive MR-OCT for in vivo imaging a ten-day-old CAM was used as a model. The CAM is a well-established model to demonstrate phase-sensitive imaging with OCT on an in vivo sample[32]. During the experiment, the CAM was placed on goniometer stage, and the Doppler angle was set to approximately 75°. The embryo temperature was maintained using an infrared heat lamp during the course of study. The scanning protocol was set to acquire 300 A lines, which covered a lateral scan range of 3 mm, and, at each lateral position, a set of eight A lines was acquired. The time taken to acquire the data was around 4 s. The phase difference between eight A lines is then averaged to form a phase difference image, as shown in Fig. 8. Figure 8(a) shows the structural image of the CAM used in this study. From the processed B scan, we can clearly resolve a micro vessel. Figure 8(b) shows the processed phase difference image. Clearly, a change of phase can be seen, which is induced by moving light scatterers, likely indicating the presence of a blood vessel. The image in Fig. 8(b) indicates the sensitivity of the phase due to blood flow. Figure 8(c) shows the depth and phase profiles taken at the two regions P1 and P2.
Figure 8.In vivo chicken embryo imaging with phase-sensitive MR-OCT system. (a) Structural image of a chicken embryo vessel and (b) the corresponding phase difference image. (c) The A line and phase profile taken at two different positions P1 and P2. Scale bar: 500 μm.
In conclusion, the application of phase-sensitive MR-OCT for phase-sensitive motion detection is demonstrated. A sequential phase difference method is implemented to extract the phase information from the interference signal. The detection accuracy of the phase-sensitive MR-OCT is demonstrated on a calibrated flow phantom. The measured velocity using phase-sensitive MR-OCT shows a good correlation with the mean velocity in the tube. Furthermore, the feasibility of phase-sensitive MR-OCT by imaging in an in vivo CAM is shown. We observe a phase change in the image of the CAM model that can be attributed to flow. The likelihood that the signal is showing flow is based on the lack of other noise surrounding the region.
References
[1] E. A. Swanson. Optical coherence tomography: Beyond better clinical care: OCT’s economic impact.
Roshan Dsouza, Hrebesh Subhash, Kai Neuhaus, Paul M. McNamara, Josh Hogan, Carol Wilson, Martin J. Leahy, "Feasibility study of phase-sensitive imaging based on multiple reference optical coherence tomography," Chin. Opt. Lett. 15, 090007 (2017)