
Jianying Hao, Xiao Lin, Yongkun Lin, Mingyong Chen, Ruixian Chen, Guohai Situ, Hideyoshi Horimai, Xiaodi Tan. [J]. Opto-Electronic Advances, 2023, 6(3): 220157
- Opto-Electronic Advances
- Vol. 6, Issue 3, 220157 (2023)
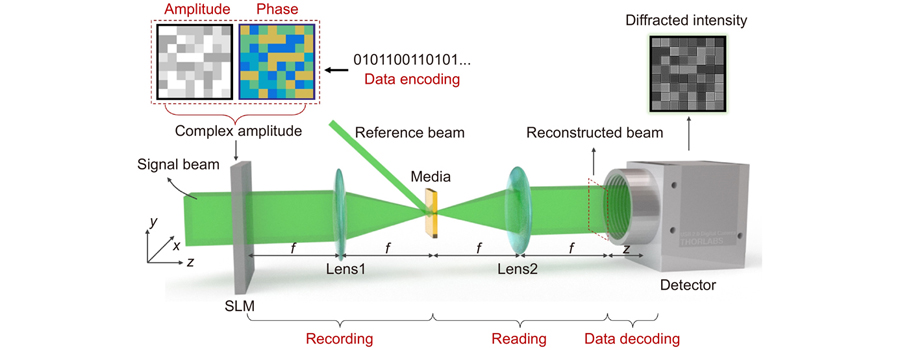
Fig. 1. Conceptual diagram of HDS with complex-amplitude-modulated data page.
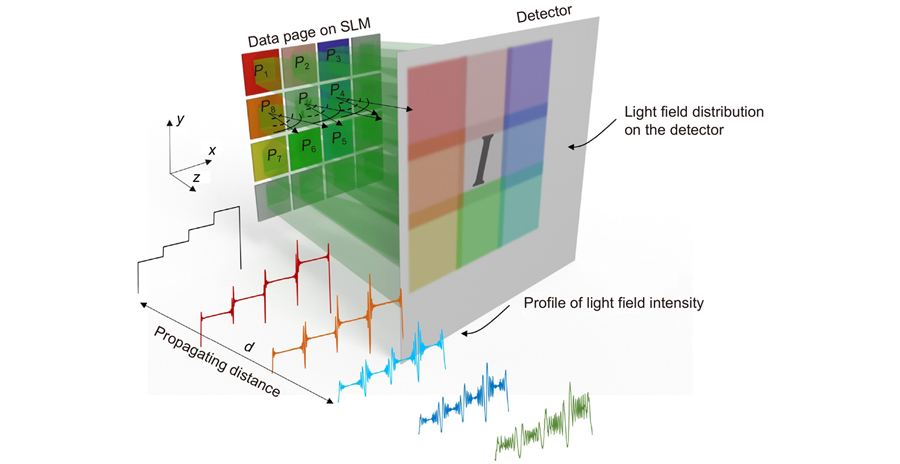
Fig. 2. Simplified theoretical model of diffraction process in HDS demodulation.
Fig. 3. Complex amplitude encoding modes and the corresponding diffraction features. (a ) Four-level amplitude data page. (b ) Four-level phase data page. (c ) Diffraction intensity image of the complex-amplitude data page (z = 2 mm). (d ) Uniform amplitude with no encoding. (e ) Four-level phase data page. (f ) Diffraction pattern of the phase-only data page (z = 2 mm). (g ) Four-level amplitude data page. (h ) Uniform phase without encoding. (i ) Diffraction pattern of the amplitude-only data page (z = 2 mm). (j ) Intensity distribution of the three intensity images in the same horizontal section.
Fig. 4. (a ) Contour map of the intensity image in Fig. 3 (c). (b ) 3D contour map of the intensity image in Fig. 3 (c). (c ) Intensity distribution on the red line in (a) and (b).
Fig. 5. (a –e ) Symbols with different phase patterns. (f –j ) Diffraction intensity distributions corresponding to symbols (a)–(e). (k ) General architecture of the symbol with 3×3 data points. (l ) Intensity profile on the red line in intensity distribution (f–j).
Fig. 6. Change in the MSE using two different phase encoding datasets with (a ) (0, π/2, π, 3π/2) and (b ) (π/6, 2π/3, π, 3π/2) when training the same neural network. (1) and (3) are the same intensity images fed to the CNN and (2) and (4) are the ground truth of the phase data page. The pages at the 1st, 20th, 40th, and 60th epoch are the phase data page retrieved from the intensity image using the trained CNN.
Fig. 7. Architecture of the convolutional neural network.
Fig. 8. Entire process flow. The green and brown lines represent the training and testing processes, respectively.
Fig. 9. (a ) Recording and reading system of HDS. (b ) Experimental setup. BS: beam splitter; HWP1, HWP2: half-wave plate; L1: collimating lens (f = 300 mm); L2–L7: relay lens (f = 150 mm); SLM1: amplitude-modulated spatial light modulator; SLM2: phase-modulated spatial light modulator; P1, P2: linear polarizer, P1 is horizontally polarized and P2 is vertically polarized. (c ) Calibration curve of SLM1. (d ) Calibration curve of SLM2. (e ) Intensity image captured by the CMOS.
Fig. 10. Complex-amplitude encoded data page and the intensity image captured by CMOS. (a ) Data page uploaded on the amplitude SLM1. (b ) Phase data page uploaded on the phase SLM2. (c ) Diffraction intensity image captured by the CMOS at a diffraction distance of 2 mm.
Fig. 11. Experimental results. (a ) Diffraction intensity image at z = 2 mm. (b ) Ground truth of amplitude data page. (c ) Amplitude predicted by CNN1. (d ) Difference between retrieved amplitude (c) and amplitude ground truth (b). (e ) Ground truth of the phase data page. (f ) Phase data page predicted by CNN2. (g ) Difference between the retrieved phase data page (f) and the phase ground truth (e).
Fig. 12. Distribution and margin histogram of the demodulated complex-amplitude signals. The horizontal axis represents the phase, and the vertical axis represents the amplitude. The histogram represents the distribution of the decoded data. The 16 colors represent the 16 complex-amplitude classifications. The arrows represent the direction of the wrong data point offset.
Fig. 13. PSNR and SSIM of the retrieved phase and amplitude data pages in the training and test datasets: (a ) PSNR and (b ) SSIM.
Fig. 14. BER distribution of all the complex-amplitude data pages in the test dataset. (a ) Amplitude BER. (b ) Phase BER.
Fig. 15. Superposition distribution of errors of all retrieved images in the data set. (a ) Pixel differences of the amplitude training set. (b ) Error data of the decoded amplitude pages in the training set. (c ) Pixel differences of the phase training set. (d ) Error data of decoded phase pages in the training set. (e ) Pixel differences of the amplitude test set. (f ) Error data of the decoded amplitude pages in the test set. (g ) Pixel differences of the phase test set. (h ) Error data of the decoded phase pages in the test set. (k ) Intensity image under the influence of noise.
| |||||||||||||||||||||||||||||
Table 0. Probability that any two sets
| |||||||||||||||||||||||||||||
Table 0. Probability that any two sets
| |||||||||||||||||||||||||||||
Table 0. Possible phase difference ∆ϕp=ϕp–ϕ under encoding rule (π/6, 2π/3, π, 3π/2).
| |||||||||||||||||||||||||||||
Table 0. Possible phase difference ∆ϕp=ϕp–ϕ under encoding rule (0, π/2, π, 3π/2).
|
Table 0. Neural network training hyperparameters.

Set citation alerts for the article
Please enter your email address
© Copyright 2018-2021 | Chinese Laser Press. All Rights Reserved 沪ICP备15018463号-20