
Wenyu Cao, Xiaodong Hu. Influence of the quantum-confined Stark effect on the temperature-induced photoluminescence blueshift of InGaN/GaN quantum wells in laser diode structures[J]. Chinese Optics Letters, 2016, 14(6): 061402
- Chinese Optics Letters
- Vol. 14, Issue 6, 061402 (2016)
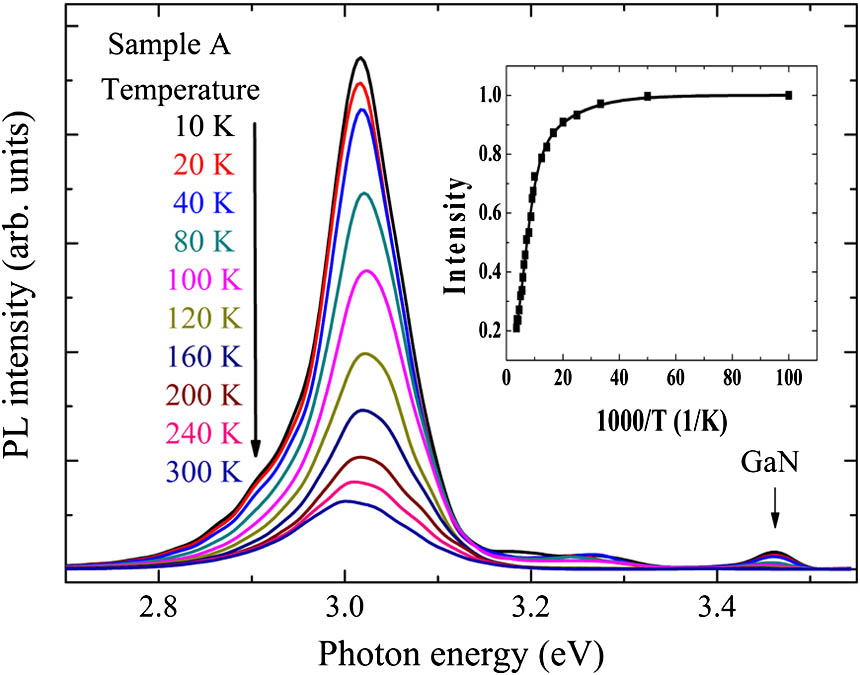
Fig. 1. PL spectra for sample A in the temperature range from 10 to 300 K. The inset shows the temperature dependence of the integrated PL intensity of the main emission with the best fitting of the Arrhenius plot.
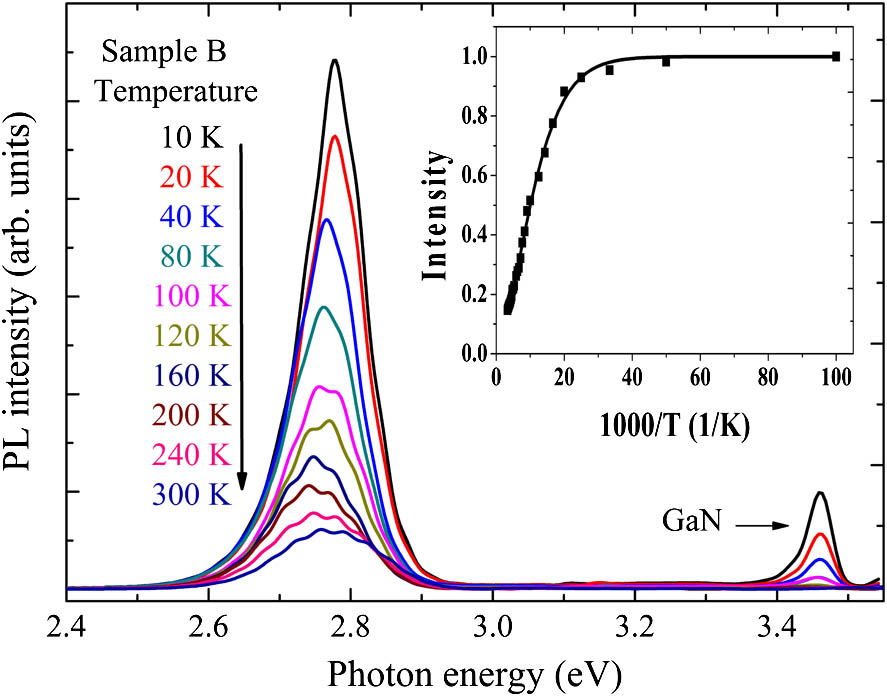
Fig. 2. PL spectra for sample B in the temperature range from 10 to 300 K. The inset shows the temperature dependence of integrated PL intensity of the main emission with the best fitting of the Arrhenius plot.
Fig. 3. Temperature dependence of PL peak energies for various excitation power densities for (a) sample A and (b) sample B.
Fig. 4. Filled circles for the blueshift range of peak energy between 10 and 150 K as a function of excitation power density in sample A; filled squares for the blueshift range of peak energy between 150 and 300 K as a function of excitation power density in sample B.
Fig. 5. Excitation power density dependence of PL peak energy at 10 K for sample A (filled circles) and peak energy at 150 K for sample B (filled squares).
Fig. 6. PL decay times at the peak positions as a function of temperature for (a) sample A and (b) sample B.
|
Table 1. Fitting Parameters of α, β, EA1, and EA2 Together with the IQE

Set citation alerts for the article
Please enter your email address
© Copyright 2018-2021 | Chinese Laser Press. All Rights Reserved 沪ICP备15018463号-20