Wenyu Cao, Xiaodong Hu. Influence of the quantum-confined Stark effect on the temperature-induced photoluminescence blueshift of InGaN/GaN quantum wells in laser diode structures[J]. Chinese Optics Letters, 2016, 14(6): 061402
Copy Citation Text
Measurements of the excitation power-dependence and temperature-dependence photoluminescence (PL) are performed to investigate the emission mechanisms of InGaN/GaN quantum wells (QWs) in laser diode structures. The PL spectral peak is blueshifted with increasing temperature over a certain temperature range. It is found that the blueshift range was larger when the PL excitation power is smaller. This particular behavior indicates that carriers are thermally activated from localized states and partially screen the piezoelectric field present in the QWs. The small blueshift range corresponds to a weak quantum-confined Stark effect (QCSE) and a relatively high internal quantum efficiency (IQE) of the QWs.
InGaN/GaN quantum wells (QWs) have been widely used as the active layers of light-emitting diodes and laser diodes in the visible and ultraviolet ranges[1–3]. To further improve the performance of a light-emitting diode or a laser diode, it is important to understand the physical mechanisms of emission in such QWs. There are two mechanisms controlling their emission behavior. First, because of the large lattice mismatch between InN and GaN (11%), the low solid miscibility between them leads to the formation of an indium-rich nanocluster structure for producing potential minima in an InGaN/GaN QW. Therefore, the exciton localization effect was widely observed[4–6]. Emission originating from the recombination of excitons localized at the potential minima in a QW may dominate its emission behavior[7,8]. Second, the piezoelectric field in an InGaN QW layer caused by the different lattice constants of InN and GaN leads to the quantum-confined Stark effect (QCSE)[9,10], which can also strongly influence the emission characteristics of an InGaN/GaN QW[11,12]. In this Letter, we present the results of a temperature-dependent and excitation-power-dependent photoluminescence (PL) study of InGaN/GaN QWs with different indium compositions. It is noteworthy that the temperature-induced blueshift range was larger when the PL excitation power was smaller, which has not been investigated before. In this Letter, a comprehensive analysis was carried out to investigate the unique phenomenon. We analyzed the peak energy of excitation-power-dependent PL and explained the particular behavior by the combined effects of carrier localization and the carrier screening effect. The smaller blueshift range in the low-indium sample indicates the weaker QCSE in the QWs, which leads to a higher IQE. Temperature-dependent time-resolved PL (TRPL) measurements were also undertaken that showed further evidence supporting our conclusions.
The InGaN/GaN QW samples under study were grown on a c-plane sapphire substrate by metal organic chemical vapor deposition[13]. First, a 1 μm-thick undoped GaN layer was deposited on the substrate. Then, after the growth of a 3 μm Si-doped GaN, an n-type 3 nm GaN superlattice (SL) structure of 160 periods was deposited on the top. A 0.1 μm-thick unintentionally doped n-type GaN waveguide layer was grown on top of the SL cladding layer. The QW structure was sandwiched between the n-type waveguide layer and a p-GaN layer of 60 nm in thickness. The QW structure included five periods of 2.5 nm-thick InGaN wells and 8 nm-thick GaN barriers. The average indium compositions in the well were 10% and 17% for samples A and B, respectively. In the PL measurements, the samples were photoexcited by a 325 nm cw He-Cd Laser. The samples were mounted on a Cu cold finger in a closed-cycle helium cryostat to vary the sample temperatures from 10 to 300 K. The excitation power was varied from 0.2 through 20 mW. The laser beam was focused to a spot of . We were thus able to reach excitation power densities of for the cw laser pump. The TRPL experiments were performed in the temperature range between 10 and 290 K using a Hamamatsu streak camera with a temporal resolution of about 5 ps. In the TRPL measurements, samples were excited by 100 fs pulses from a frequency-doubled mode-locked Ti:sapphire laser, which had a repetition rate of 76 MHz. The excitation photon energy and power of the TRPL measurements were 3.1 eV and 30 mW, respectively.
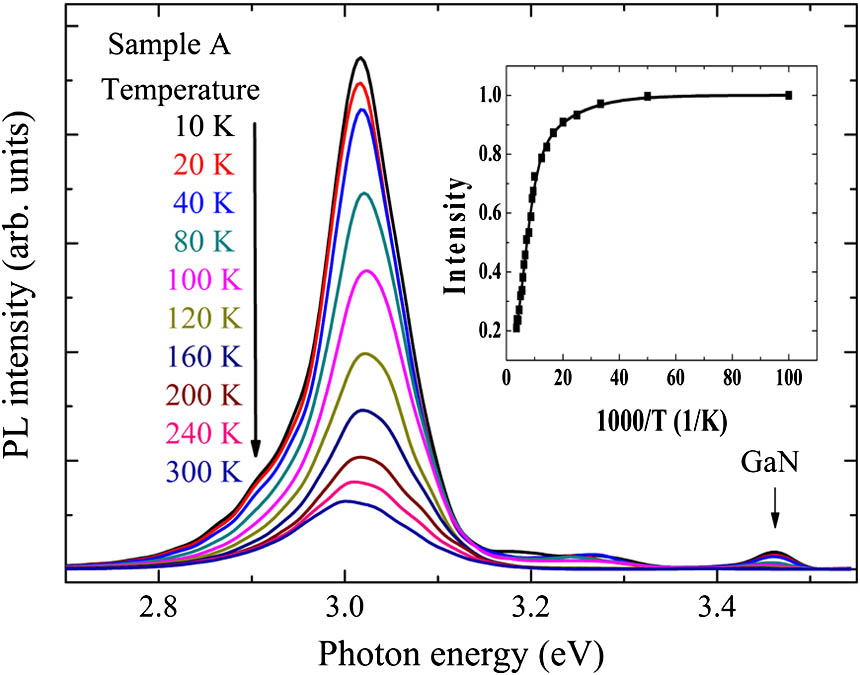
Figures 1 and 2 show the evolution of PL spectra pumped with excitation power density for sample A and sample B over a temperature range from 10 to 300 K. As the temperature is decreased, the nonradiative processes are reduced and radiative recombination becomes dominant, which leads to the increase in the PL intensity. In the PL spectra at 10 K, the main emission peak centered around 3.016 eV (Fig. 1) and 2.776 eV (Fig. 2) originated from the InGaN/GaN QWs, and a secondary peak at 3.46 eV was also observed due to the emission of the GaN layer.
Sign up for Chinese Optics Letters TOC. Get the latest issue of Chinese Optics Letters delivered right to you!Sign up now
Figure 1.PL spectra for sample A in the temperature range from 10 to 300 K. The inset shows the temperature dependence of the integrated PL intensity of the main emission with the best fitting of the Arrhenius plot.
Figure 2.PL spectra for sample B in the temperature range from 10 to 300 K. The inset shows the temperature dependence of integrated PL intensity of the main emission with the best fitting of the Arrhenius plot.
The Arrhenius plot of the normalized integrated PL intensity for samples A and B are also shown in the insets of Figs. 1 and 2. The Arrhenius plot formula used to fit the integrated PL intensity is where represents the normalized integrated PL intensity at temperature . The parameters and stand for two constants corresponding to the density of the nonradiative recombination centers in the samples. In Figs. 1 and 2, the integrated PL intensity decreased slowly at low temperatures, then it decreased fast in the high temperature region. and denote the two activation energies in the low and high temperature ranges, respectively. The low one can be attributed to the localized exciton binding energy, and the high one is considered as the potential barrier between the localized potential minima and the nonradiative centers in the multiple QW (MQW). The parameters used for fitting are listed in Table 1. It is noteworthy that represents the strength of the carrier localization. According to the fitting results, we can see that the activation energy of sample A is smaller than that of sample B, which indicates that carriers can more easily escape from the localized states. Generally, the internal quantum efficiency (IQE) can be defined as the integrated PL intensity ratio between 10 and 300 K, which is based on the assumption of an internal efficiency of 100% at low temperatures. The IQE is about 21% for sample A, which is larger than that of sample B (nearly 14%). A larger in sample B corresponds to a stronger carrier localization and the enhancement of the carrier localization can result in the increase of the IQE. On the contrary, the IQE of sample B is lower than that of A. which indicates that the influence of QCSE plays an important role in our samples. In the QCSE, with the potential tilt in the well layer, the electrons and holes were spatially separated such that the emission spectral peak was redshifted and the emission efficiency was reduced. Since a stronger QCSE leads to a lower IQE, it is necessary to study the condition of QCSE in QWs.
Sample
IQE (%)
α
β
EA1 (meV)
EA2 (meV)
A
21
0.5
56.5
6.9
37.1
B
14
5.6
70.6
15.4
52.3
Table 1. Fitting Parameters of α, β, EA1, and EA2 Together with the IQE
Figure 3(a) shows the PL spectral peak energies at different excitation power densities as functions of temperature for sample A. The PL spectral peak energy first exhibited a blueshift with increasing temperature in the range of 10–150 K and then a redshift in the higher temperature range between 150 and 300 K. In the whole temperature range, the lattice thermalization mechanism leading to bandgap shrinkage was always effective[6]. The blueshift had been attributed to the energy level elevation of the thermalized carriers within the localized states[6,14]. The blueshift trend in the range of 10–150 K could also be explained by the carrier screening effect[11,12,15,16]. When the sample temperature increased, the carriers that escaped from the localized states can partially screen the dc fields in the QWs, thereby reducing the QCSE and leading to a blueshift behavior before the redshift of the bandgap shrinkage dominated by the temperature-dependent variation. It is noted that the aforementioned blueshift range depended on the strength of the carrier localization. In an InGaN/GaN QW of a relatively lower indium content, the potential traps of indium-rich clusters were relatively shallower such that it was relatively easier for the carriers to escape from the localized states. In this situation, either mechanism for the blueshift mentioned above (carrier thermalization within the localized states or carrier delocalization for screening the piezoelectric field) could be observed in a relatively lower temperature range.
Figure 3.Temperature dependence of PL peak energies for various excitation power densities for (a) sample A and (b) sample B.
Figure 3(b) shows the temperature-dependent variations of the PL spectral peak energy of sample B with various excitation power densities. It is noted that the peak energy exhibited a redshift trend in the low temperature range between 10 and 150 K. Since the indium composition was relatively higher (17%) in sample B and its localization effect was stronger. Therefore, in this sample the blueshift trend was observed in the higher temperature range (150–300 K). The redshift trend in the temperature range of 10–150 K could be attributed to bandgap shrinkage. It may also be due to the thermally induced hopping of carriers from the shallower localization centers into the deeper ones.
As mentioned earlier, the PL spectral peak energy exhibited a blueshift with increasing temperature in the range of 10–150 K for sample A and 150–300 K for sample B. So the blueshift range was defined as the PL peak energy difference between 10 and 150 K for sample A and between 150 and 300 K for sample B. In both Figs. 3(a) and 3(b), one may observe that the blueshift range of the PL spectral peak energy became smaller when the PL excitation power density was increased. We use the Varshni formula to calculate the bandgap shrinkage-induced redshift, where and are known as Varshni’s fitting parameters. The temperature-induced bandgap shrinkage is calculated with the parameters /K and . When sample A is pumped with an excitation power density of , the blueshift between 10 and 150 K is as large as 24.2 meV, whereas the expected temperature-induced change of the bandgap energy is 11.4 meV, according to the Varshni equation. Thus, the actual displacement of the emission peak is 35.6 meV. In sample B, such a blueshift (150–300 K) is even larger, exceeding 53 meV. Because the expected temperature-induced change in the bandgap energy is 26.3 meV. The actual blueshift range is 79.3 meV. To illustrate this more clearly, we plotted the blueshift ranges as a function of the PL excitation power density for the two samples in Fig. 4. Here, one can see that the blueshift ranges of sample B were significantly larger than those of sample A. Also, even though the blueshift trends were observed in different temperature ranges, their dependencies on the PL excitation power density were similar. To understand the origin of this variation in the trend, in Fig. 5 we showed the PL spectral peak energies as a function of the excitation power density at the start temperature of the blueshift (10 K for sample A and 150 K for sample B, as shown in Fig. 3). Since a QW has a step-function-like density-of-state distribution, the PL spectral energy variation should be linear at low temperatures if the band-filling effect dominates the process[17]. However, as shown in Fig. 5, the PL spectral energy increased with the excitation power density in a sublinear manner, indicating that the band-filling effect was not the dominating factor for the observed spectral shift. The major factor for the observed spectral shift was the carrier screening effect[9,17]. As a consequence of that, the slope of the curve was greater at lower excitation power densities, in Fig. 5. This dependence was well explained by the carrier screening effect, which compensated the piezoelectric field[17]. At low excitation power densities, the piezoelectric field was larger and the QCSE was stronger. So when the carrier density increased the screening effect became prominent, inducing a larger energy shift. With the excitation power density increased, the QCSE was reduced. Due to a less effective screening effect, the energy shift was smaller and there was a trend toward saturation.
Figure 4.Filled circles for the blueshift range of peak energy between 10 and 150 K as a function of excitation power density in sample A; filled squares for the blueshift range of peak energy between 150 and 300 K as a function of excitation power density in sample B.
Figure 5.Excitation power density dependence of PL peak energy at 10 K for sample A (filled circles) and peak energy at 150 K for sample B (filled squares).
Another explanation for the origin of the blueshift is that many carriers that were frozen out in nonradiative centers at low temperatures will become thermally activated as the temperature increases, inducing some partial screening of the piezoelectric field[9,12]. In Fig. 3, the temperature-induced blueshift range is larger than the blueshift when the excitation power increases by several times. The number of carriers in nonradiative centers could not be so large. We attribute the variation trend to the screening of the QCSE caused by delocalized carriers from localization centers rather than nonradiative centers. At low temperatures, many carriers were confined in the localized states; when the temperature increased, more thermally activated carriers escaped from the localized states, the free carrier density increased, and the carriers partially screened the piezoelectric field. Because the emission energy shift was larger for lower excitation power densities with the same amount of increase in the carrier density (Fig. 5), the blueshift range was larger under lower excitation power densities (Fig. 4). Furthermore, as shown in Fig. 4, the blueshift range in sample B was larger than that in sample A, which indicated that there were larger piezoelectric fields and stronger QCSEs and the carrier screening effect was more significant, resulting in the larger blueshift range in sample B. Because the QCSE of sample A was weaker than that of sample B, the enhanced emission efficiency of sample A could be mainly attributed to the reduced QCSE. Due to the smaller QCSE, the electron and hole wave function overlap in the MQWs of sample A is larger than that of sample B, improves the radiative recombination rate, and thus leads to a higher IQE in sample A.
We demonstrated that the carrier screening effect was dominant in the low-temperature region (10–150 K) for sample A and the high temperature region (150–300 K) for sample B. Figure 6 shows the PL decay times obtained from a single exponential fit with the PL decay profile as functions of temperature. When the temperature increased from 80 to 300 K, the decreasing trend in the PL decay times was due to an increasing nonradiative rate and possibly carrier escaping in both samples. In Fig. 6(a), the lifetime for sample A was 3.7 ns at 10 K and decreased gradually with temperature. Because nonradiative recombination was less effective for low temperatures, we attributed the decreasing trend to the carrier screening effect caused by temperature-induced delocalized carriers at the low temperature region. When the temperature increased, more carriers were delocalized and partially screened the QCSE and the spatial overlap between the electron and hole wave functions was enhanced, which resulted in a decrease in the PL decay time at low temperatures. In contrast, the lifetime temperature dependencies were quite different in sample B [Fig. 6(b)]. The longer decay time (14 ns) at 10 K was attributed to a relatively larger carrier localization. The PL lifetime increased with temperatures up to 70 K and then decreased as the temperature rose. The increasing trend was a signature of radiative recombination involving partial localization states[18]. In other words, the carrier transported from higher-energy localized states to lower ones with a reasonable amount of thermal energy, which extended the lifetime[19]. The localization was dominant in the low temperatures for sample B and the screening effect from delocalized carriers performed an important function from low temperatures in sample A. So the different blueshift ranges appeared in the low temperature region in sample A (10–150 K) and the high temperature region in sample B (150–300 K).
Figure 6.PL decay times at the peak positions as a function of temperature for (a) sample A and (b) sample B.
In conclusion, we analyze PL and TRPL results from InGaN/GaN QWs. In a certain temperature range, we find that the temperature-induced blueshift range decreases with increasing excitation power density. We attribute the variation trend to the screening effect caused by delocalized carriers from localization centers. The sample with a low indium composition shows a smaller blueshift range, which reflects the weaker QCSE in QWs. The weaker QCSE improves the radiative recombination rate and thus leads to a higher IQE. The high activation energy in the sample with a higher indium composition indicates a strong carrier localization, which can lead to the increase of IQE. But the blueshift range is much larger than that of the low-indium sample, indicating that there is a stronger QCSE in QWs that actually results in a reduction of IQE. On the whole, we can conclude that different blueshift ranges manifest the different magnitudes of QCSE. It would be essential to weaken the QCSE in the QW. In addition, the present results will provide useful guidance to achieve a high-performance laser diode with a high IQE.
Wenyu Cao, Xiaodong Hu. Influence of the quantum-confined Stark effect on the temperature-induced photoluminescence blueshift of InGaN/GaN quantum wells in laser diode structures[J]. Chinese Optics Letters, 2016, 14(6): 061402