• Journal of Infrared and Millimeter Waves
  • Vol. 40, Issue 5, 582 (2021)
Peng-Yu KE1、2、3, Meng-Xuan LIU1、2、3、4, Xu-Quan WANG1、2、3, Song-Lei HUANG1、2、*, Yong-Gang ZHANG1、2, and Jia-Xiong FANG1、2、**
Author Affiliations
  • 1State Key Laboratories of Transducer Technology,Shanghai Institute of Technical Physics,Chinese Academy of Sciences,Shanghai 200083,China
  • 2Key Laboratory of Infrared Imaging Materials and Detectors,Shanghai Institute of Technical Physics,Chinese Academy of Sciences,Shanghai 200083,China
  • 3University of Chinese Academy of Sciences,Beijing 100049,China
  • 4Shanghai Tech University,Shanghai 201210,China
  • show less
    DOI: 10.11972/j.issn.1001-9014.2021.05.003 Cite this Article
    Peng-Yu KE, Meng-Xuan LIU, Xu-Quan WANG, Song-Lei HUANG, Yong-Gang ZHANG, Jia-Xiong FANG. Development of 512 × 2-element InGaAs spectral sensor IoT node[J]. Journal of Infrared and Millimeter Waves, 2021, 40(5): 582 Copy Citation Text show less
    Diagram of spectral node test system
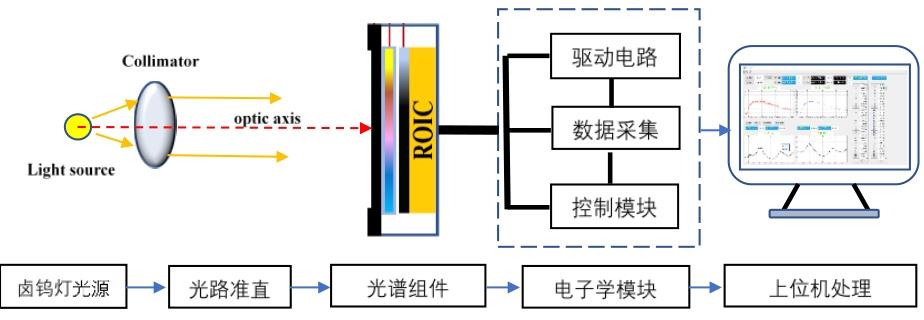
    Fig. 1. Diagram of spectral node test system
    512×2 InGaAs Spectral sensor:(a)The image of spectral sensor(b)Spectral sensor architecture
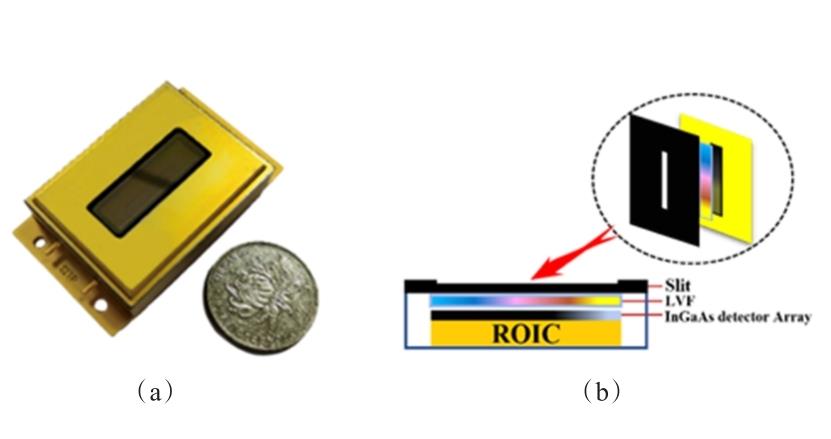
    Fig. 2. 512×2 InGaAs Spectral sensor:(a)The image of spectral sensor(b)Spectral sensor architecture
    Schematic of the optical configurations
    Fig. 3. Schematic of the optical configurations
    Schematic of the signal acquisition process
    Fig. 4. Schematic of the signal acquisition process
    Timing diagram of SITP 512×2 InGaAs detector
    Fig. 5. Timing diagram of SITP 512×2 InGaAs detector
    Schematic of the experimental platform:1. Light source,2. Transmission sample tank,3. SRM2035a standard reference material,4. Beam expander,5. Spectral node
    Fig. 6. Schematic of the experimental platform:1. Light source,2. Transmission sample tank,3. SRM2035a standard reference material,4. Beam expander,5. Spectral node
    Spectral-node response characteristics of the 1650 nm DFB laser
    Fig. 7. Spectral-node response characteristics of the 1650 nm DFB laser
    Baseline stability test results of light source
    Fig. 8. Baseline stability test results of light source
    Spectral response curves of pixels and related wavelengths
    Fig. 9. Spectral response curves of pixels and related wavelengths
    The absorbance curves of alcoholic beverages with different nominal concentrations were measured,
    Fig. 10. The absorbance curves of alcoholic beverages with different nominal concentrations were measured,

    Standard wavelength

    /nm

    1075.6

    ±0.1

    1151.5

    ±0.1

    1222.2

    ±0.2

    1366.8

    ±0.1

    1469.1

    ±0.2

    Test11074.91151.01218.91366.31466.7
    Test21074.91151.01219.01366.31466.7
    Test31074.81151.01219.01366.21466.7
    Test41075.01150.71219.11366.31466.7
    Test51074.91150.71219.01366.11466.6
    Accuracy-0.7-0.7-3.2-0.6-2.4
    Repeatability0.20.30.20.20.1
    Table 1. Wavelength accuracy and repeatability test of SRM2035a
    Peng-Yu KE, Meng-Xuan LIU, Xu-Quan WANG, Song-Lei HUANG, Yong-Gang ZHANG, Jia-Xiong FANG. Development of 512 × 2-element InGaAs spectral sensor IoT node[J]. Journal of Infrared and Millimeter Waves, 2021, 40(5): 582
    Download Citation