
G. Lehmann, K. H. Spatschek. Reflection and transmission properties of a finite-length electron plasma grating[J]. Matter and Radiation at Extremes, 2022, 7(5): 054402
- Matter and Radiation at Extremes
- Vol. 7, Issue 5, 054402 (2022)
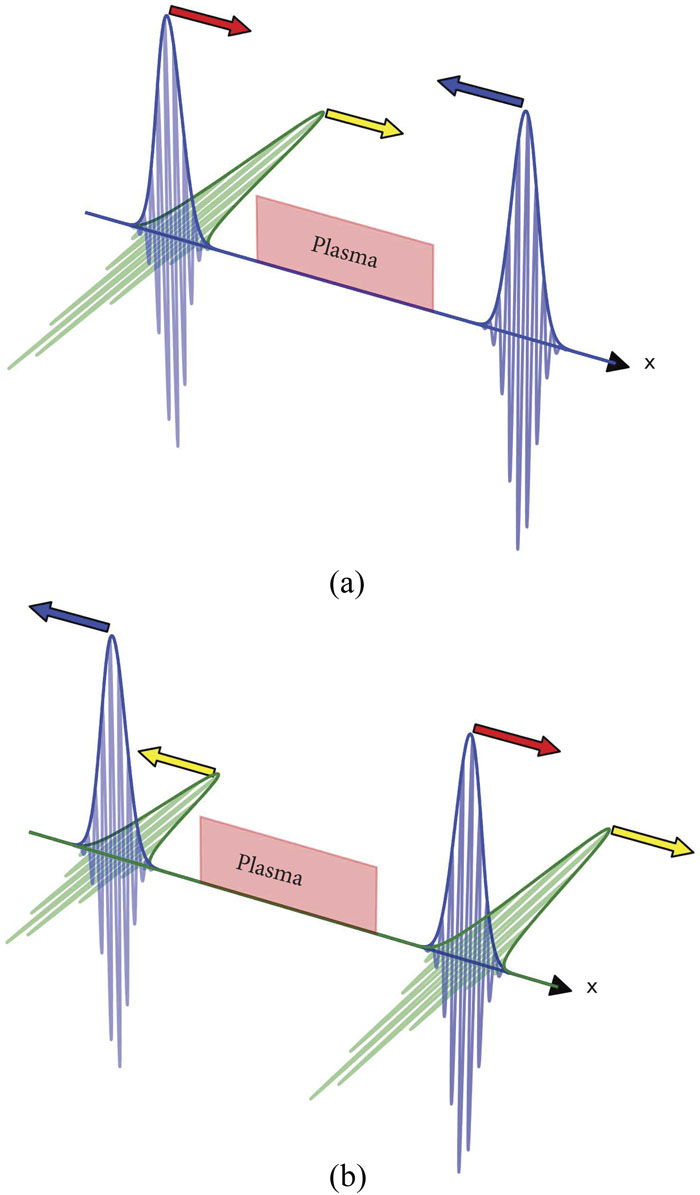
Fig. 1. (a) Initial situation in which two counterpropagating pulses approach a plasma slab; the left one (in purple and green) is circularly polarized, while the right one (in purple) is linearly polarized. (b) Transmission and reflection after the initial pulses have traversed the plasma.
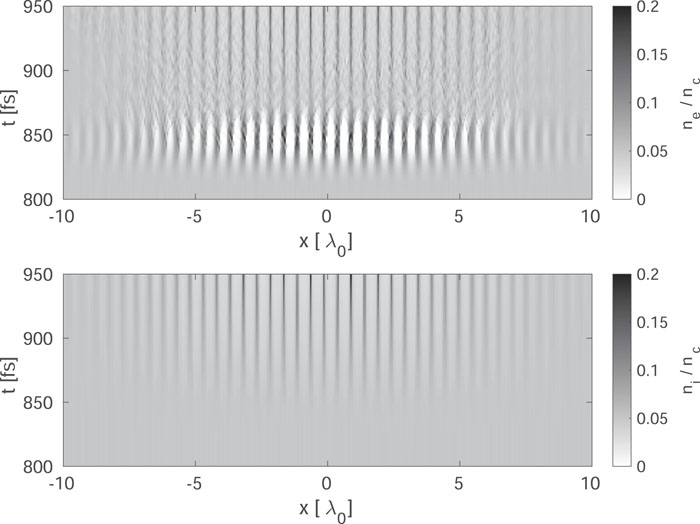
Fig. 2. Temporal evolutions of electron density n e (upper) and ion density n i (lower) in center of plasma. The initial homogeneous plasma density is n 0 = 0.05n c . At 830 fs, the laser pulses start interacting. Their duration is 40 fs (FWHM), and the E y components have equal intensity of 1017 W/cm2.
Fig. 3. (a) Spatial modulations of electron density (blue or light gray line) and ion density (black line) at t = 850 fs. (b) Temporal evolutions of electron density (blue or light gray line) and ion density (black line) at x = 0.5λ 0. The main overlap of the two laser pulses occurs between 830 and 870 fs, and the parameter values are the same as those for Fig. 2 .
Fig. 4. Electric fields E y and E z at times (a) t = 400 fs (blue and green lines) and (b) t = 1100 fs (red and black lines), i.e., before (a) and after (b) the interaction inside the plasma (indicated by the central box). The arrows indicate the propagation direction of each pulse component, and the parameter values are the same as those for Fig. 2 .
Fig. 5. (a) Transmission ratio T (black lines) and reflection ratio R (blue or light gray lines) as functions of the FWHM pulse duration τ . (b) Ratio R /T as a function of τ . The line styles in (a) and (b) correspond to the intensities 1017 W/cm2 (solid lines), 5 × 10¹⁶ W/cm2 (dashed lines), and 2.5 × 10¹⁶ W/cm2 (dotted lines with crosses).
Fig. 6. Visualization of four-wave-mixing scenario discussed herein. Waves 1 and 2 produce the grating, while wave 4 propagates therein, becoming partially transmitted and partially reflected (the latter being wave 3). Shown here is a general four-wave-mixing scenario, including wave 3 in the region L ≤ x < ∞ originating from +∞ ; however, in the present application, the amplitude A 3(L ) of wave 3 at the right plasma boundary is zero.
Fig. 7. (a) Plots of reflection coefficient R = | e − x − e x e − x + e x | 2 T = | 2 e − x + e x | 2 κL . (b) Ratio R / T κL .
Fig. 8. Plot of ρ ≡ R / T = | T 12 | 2 N for n 0 = 0.05n c , a = b = 0.5Λ, n a = 1.8n 0, and n b = 0.2n 0. The frequency is ω = ω 0. Subfigure (a) shows that for N → ∞ , the bangap of an infinite configuration is obtained. Subfigure (b) is a magnified part of subfigure (a) for better comparison with the numerical results.

Set citation alerts for the article
Please enter your email address
© Copyright 2018-2021 | Chinese Laser Press. All Rights Reserved 沪ICP备15018463号-20