• Advanced Photonics Nexus
  • Vol. 2, Issue 1, 016012 (2023)
Jianyong Wang1、2、†, Junchao Fan3, Bo Zhou1, Xiaoshuai Huang4、5、*, and Liangyi Chen1、6、7、8、*
Author Affiliations
  • 1Peking University, Institute of Molecular Medicine, College of Future Technology, Center for Life Sciences, State Key Laboratory of Membrane Biology, Beijing Key Laboratory of Cardiometabolic Molecular Medicine, Beijing, China
  • 2Peking University, School of Software and Microelectronics, Beijing, China
  • 3Chongqing University of Posts and Telecommunications, College of Computer Science and Technology, Chongqing Key Laboratory of Image Cognition, Chongqing, China
  • 4Peking University, Biomedical Engineering Department, Beijing, China
  • 5Peking University, International Cancer Institute, Beijing, China
  • 6PKU-IDG/McGovern Institute for Brain Research, Beijing, China
  • 7Beijing Academy of Artificial Intelligence, Beijing, China
  • 8National Biomedical Imaging Center, Beijing, China
  • show less
    DOI: 10.1117/1.APN.2.1.016012 Cite this Article Set citation alerts
    Jianyong Wang, Junchao Fan, Bo Zhou, Xiaoshuai Huang, Liangyi Chen. Hybrid reconstruction of the physical model with the deep learning that improves structured illumination microscopy[J]. Advanced Photonics Nexus, 2023, 2(1): 016012 Copy Citation Text show less

    Abstract

    Structured illumination microscopy (SIM) has been widely used in live-cell superresolution (SR) imaging. However, conventional physical model-based SIM SR reconstruction algorithms are prone to artifacts in handling raw images with low signal-to-noise ratios (SNRs). Deep-learning (DL)-based methods can address this challenge but may lead to degradation and hallucinations. By combining the physical inversion model with a total deep variation (TDV) regularization, we propose a hybrid restoration method (TDV-SIM) that outperforms conventional or DL methods in suppressing artifacts and hallucinations while maintaining resolutions. We demonstrate the performance superiority of TDV-SIM in restoring actin filaments, endoplasmic reticulum, and mitochondrial cristae from extremely low SNR raw images. Thus TDV-SIM represents the ideal method for prolonged live-cell SR imaging with minimal exposure and photodamage. Overall, TDV-SIM proves the power of integrating model-based reconstruction methods with DL ones, possibly leading to the rapid exploration of similar strategies in high-fidelity reconstructions of other microscopy methods.

    1 Introduction

    Superresolution (SR) fluorescence microscopy provides nanoscale resolution for studying subcellular structures and biological processes.17 However, the higher light dose required for SR imaging than conventional microscopy, phototoxicity, and photobleaching severely limit their applications in live-cell imaging.8 Structured illumination microscopy (SIM) demonstrates a higher photon efficiency than other SR microscopy.911 In particular, two-dimensinal (2D)-SIM can achieve a doubling resolution beyond the light diffraction limit using nine sequentially acquired images, making it useful for live-cell SR imaging. However, live-cell SR-SIM imaging still suffers from phototoxicity and photobleaching, and image restoration is an ill-posed inverse problem.9,10,1215 Therefore, for raw images of low signal-to-noise ratio (SNR) caused by short exposure or excessive photobleaching, the conventional Wiener-based reconstruction method is prone to artifacts.1619

    Various physical model-based restoration methods have been developed to suppress SIM artifacts, such as total variation regularization,19 notch filtering,16,18 high-fidelity (HiFi)-SIM,20 and joint space and frequency reconstruction-SIM.21 Using spatiotemporal continuity as the prior knowledge, we have developed an iterative restoration method based on the Hessian regularization term (Hessian-SIM) that suppresses artifacts due to the amplification of random noise.18 However, other artifacts persist, such as hammer-stroke and honeycomb artifacts due to the out-of-focus background17,18,20 and artifacts due to illumination scattering,22 which cannot be suppressed completely by model-based methods. Deep neural networks can approximate arbitrary functions with infinitesimal errors to extract high-dimensional features from low-resolution and low-quality images.23 Therefore, researchers have proposed end-to-end deep-learning (DL)-based reconstruction algorithms to suppress different artifacts indiscriminately with low SNR raw SIM images.2426 However, DL-based methods may suffer from hallucinations27 and generally reduced resolution. For example, current DL methods often incorrectly predict mitochondrial cristae structures in live cells.

    To combine the advantages of both methods, we try to balance the reconstruction fidelity of traditional methods and the artifacts suppression of DL methods. However, suppose these two parts are combined into one objective function to achieve simultaneous optimization; in that case, the network is required to calculate the partial differential28 of the input images rather than the normal network weights. Therefore, we utilized the total deep variation (TDV) network as a regularizer in the reconstruction objective function. By combining the physical SIM reconstruction procedure with the TDV regularizer,28 we propose a hybrid restoration method (TDV-SIM) to suppress artifacts and maintain resolution simultaneously. On processing images of different cellular structures, TDV-SIM retains the actual signals better than the pure DL methods while removing artifacts more effectively than the model-based methods.

    2 Methods

    2.1 Principle and Parameter Selection of TDV-SIM

    For SIM imaging, the sample is excited by sinusoidal illuminations with different pattern orientations and phases. The raw images contain low- and high-frequency information, which need to be separated and reassembled in SIM reconstruction.16,18,19 We transformed the SIM reconstruction into an optimization problem and constructed an objective function [Eq. (1)] composed of the fidelity term D(f,g) based on the physical model and the TDV regularization term R(f) based on DL (Supplementary Note 1 in the Supplementary Material), minfD(f,g)+λR(f),where f is the target image to be estimated, g is the inverse Fourier transform of the high- and low-frequency information separated from the SIM raw data, and λ is the weight parameter of the regularization term. By optimizing the objective function with the gradient descent algorithm [Eq. (2)], TDV-SIM can reconstruct SR-SIM images that preserve the high-frequency information more faithfully than pure DL-based methods, and suppress artifacts more effectively than pure model-based methods, fk+1=fkηD(fk,g)ηλR(fk),where η is the step size. The entire reconstruction pipeline is shown in Fig. 1(a), where f0 is the initial SIM image obtained by Wiener deconvolution and fT is the final reconstruction after T iterations. The computation pipeline of R(f) is shown in Fig. 1(b).

    TDV-SIM diagrams and parameter selection. (a) TDV-SIM reconstruction pipeline. (b) Visualization of TDV and its gradient. Mi is a residual structure micro-block and GM is its gradient. Conv is the convolution layer and T-Conv is its gradient. Act is the activation layer and GAct is its gradient. (c) Actin filaments SIM SR image. (d) Top, PSNR and SSIM of TDV-SIM reconstructions with different λ and T; bottom, TDV-SIM reconstruction durations of single SR image (1024×1024) with different T (n=5). (e) Magnified views of the boxed regions in panel (c). Yellow arrowheads highlight artifacts not eliminated with too small λ or T. White arrowheads indicate incorrectly removed signals with too large λ or T. Scale bars: (c) 1 μm and (e) 0.5 μm.

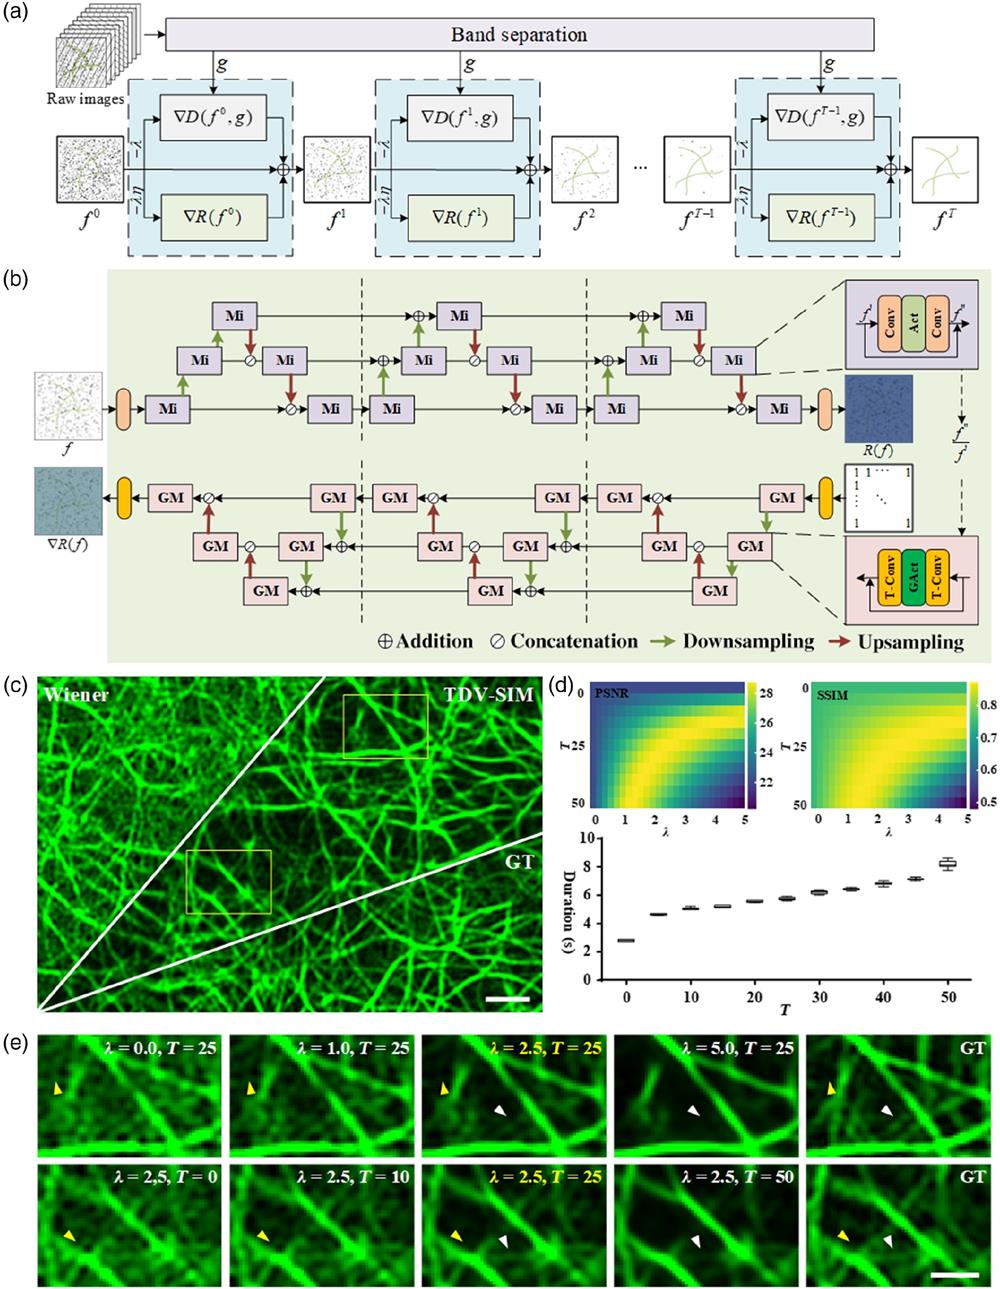
    Figure 1.TDV-SIM diagrams and parameter selection. (a) TDV-SIM reconstruction pipeline. (b) Visualization of TDV and its gradient. Mi is a residual structure micro-block and GM is its gradient. Conv is the convolution layer and T-Conv is its gradient. Act is the activation layer and GAct is its gradient. (c) Actin filaments SIM SR image. (d) Top, PSNR and SSIM of TDV-SIM reconstructions with different λ and T; bottom, TDV-SIM reconstruction durations of single SR image (1024×1024) with different T (n=5). (e) Magnified views of the boxed regions in panel (c). Yellow arrowheads highlight artifacts not eliminated with too small λ or T. White arrowheads indicate incorrectly removed signals with too large λ or T. Scale bars: (c) 1  μm and (e) 0.5  μm.

    Compared to the ground truth (GT) image of actin filaments [averages of multiple Wiener-processed images, Fig. 1(c)], we quantized the peak SNR [PSNR; Fig. 1(d), top left] and structural similarity index measure [SSIM; Fig. 1(d), top right] values of TDV-SIM reconstructions with different weight parameters λ and iteration numbers T. The TDV-SIM reconstruction duration of a single SR image (1024×1024) with different iteration numbers T is also demonstrated [Fig. 1(d), bottom]. Through human inspection [Fig. 1(e)], artifacts may not be suppressed entirely if λ (or T) is too small; in contrast, if λ (or T) is too large with a fixed T of 25 (or a λ of 2.5), genuine signals may be removed incorrectly. Thus we set the optimal parameters to be 2.5 and 25 for λ and T, respectively.

    2.2 Cell Culture and Labeling

    COS-7 cells (ATCC and CRL-1651) were cultured in high-glucose Dulbecco’s modified Eagle’s medium (Gibco, 21063029) supplemented with 10% fetal bovine serum (Gibco) and 1% 100 mM sodium pyruvate solution (Sigma-Aldrich, S8636) in an incubator at 37 °C with 5% CO2 until reaching 75% confluency.

    To label mitochondria, COS-7 cells were incubated with 250 nM MitoTracker Green FM (Thermo Fisher Scientific, M7514) in an hank’s balanced salt solution medium (Thermo Fisher Scientific, 14025076) containing Ca2+ and Mg2+ at 37 °C for 15 min, followed by washing 3 times before conducting 2D-SIM imaging. To label actin, COS-7 cells were transfected with Lifeact-enhanced green fluorescent protein (EGFP). According to the manufacturer’s instructions, the transfections were executed using Lipofectamine 2000 (Thermo Fisher Scientific, 11668019). After transfection, the cells were plated on precoated coverslips. Live cells were imaged in a complete cell culture medium containing no phenol red in a 37 °C live-cell imaging system. To label endoplasmic reticulum (ER), COS-7 cells were transfected with EGFP-Lys-Asp-Glu-Leu. According to the manufacturer’s instructions, the transfections were executed using Lipofectamine 3000 (Thermo Fisher Scientific, L3000015). After transfection, the cells were cultured for 20 to 28 h before the experiments. Live cells were imaged in a complete cell culture medium containing no phenol red in a 37 °C live-cell imaging system. The cells were tested for mycoplasma contamination before use.

    2.3 Image Acquisition, Preprocessing, and Training

    The same SIM settings in Hessian-SIM18 were used. To obtain low SNR raw images and the corresponding GT images for training the neural network, we imaged the specimen with SIM. We recorded 20 images for each illumination pattern and then changed the phase and orientation of the pattern. We repeated the cycle nine times, corresponding to three orientations multiplied by three phases, thus obtaining 180 raw images. Then we divided the raw images into 20 groups, with each group containing nine illumination patterns of three phases and three orientations. After removing the fluorescent background, we can obtain 20 SR images with artifacts using Wiener deconvolution. Finally, we mimicked the artifact-free GT by averaging the 20 SR images.

    We imaged 20cells, and the images were preprocessed to obtain pairs of raw data and GT images at each time point. Next, we divided such image pairs into a training set, a validation set, and a test set; then, we applied random cropping, quarter rotating, and horizontal/vertical flipping to further enrich the training data set. We trained the TDV-SIM using an Adam optimizer, with the learning rate set to 104. For actin, we adopted the mean square error (MSE) loss function, lMSE(X,Y)=1H×Wi=1Hj=1W(Xi,jYi,j)2,where W and H represent the image width and height, respectively. For mitochondria and ER, a combination of the MSE loss and the SSIM loss was used, lcombination(X,Y)=lMSE(X,Y)+k[1SSIM(X,Y)],where k is a scalar weight that balances the relative contributions of SSIM and MSE losses and is set to 0.1 throughout this paper.

    2.4 Calculation of Assessment Metrics

    To avoid the influence of different methods on the dynamic range of the inferred SR images, we first normalize the SR images, Norm(X)=Xmin(X)max(X)min(X).We used the PSNR, SSIM, and normalized root MSE (NRMSE) to evaluate the similarity between the reconstructed image and GT. They were calculated as follows: PSNR(X,Y)=10×lg[MAXI2i=1Hj=1W(Xi,jYi,j)2/(H×W)],SSIM(X,Y)=(2μXμY+c1)(2σXY+c2)(μX2+μY2+c1)(σX2+σY2+c2),NRMSE(X,Y)=i=1Hj=1W(Xi,jYi,j)2/(H×W)max(Y)min(Y),where W and H represent the image width and height, respectively. X and Y represent the reconstruction result and the GT image, respectively. MAXI is the maximum possible pixel value of the image and equals to 2B1 when the image is represented with linear pulse-code modulation of B bits (e.g., MAXI equals 255 for an 8-bit image). μX and μY represent the averages of X and Y, σX and σY represent the variances of X and Y, and σXY represents the covariance of X and Y. c1 and c2 are small positive constants that stabilize each term; c1=(0.01L)2, c2=(0.03L)2, where L is the dynamic range of the pixel values.

    Artifacts often emerged in regions of minor signals, such as the meshed region within actin filaments. Therefore, benchmarked against the GT, we selected these regions to calculate their variances.

    3 Results

    3.1 TDV-SIM Excels in Restoring Regular Structures Imaged with a Low SNR

    We compared TDV-SIM with other reconstruction methods, including physical-model-based (Wiener deconvolution,11 HiFi-SIM, and Hessian-SIM) and pure DL-based methods [skip-layer connecting U-Nets (scU-Net)24 and deep Fourier channel attention network (DFCAN)25] using synthetic images with known GT (Fig. S1 in the Supplementary Material). TDV-SIM confers balanced performance in generating SR images of high SSIM, low NRMSE, and low artifacts among all reconstruction methods. Next, we examined dynamic actin filaments and ER in live cells observed with short exposures [actin: 1 ms, Fig. 2(a); 2.7 ms, Fig. S2a in the Supplementary Material; and ER: 0.789 ms, Fig. 2(d)]. Despite the improved reconstructions compared to the Wiener deconvolution, HiFi-SIM and Hessian-SIM still produced artifacts due to noise amplification in background regions with low SNR. TDV-SIM produced more continuous actin filaments (Fig. S2e in the Supplementary Material) with fewer artifacts but comparable SSIM values and resolutions to the conventional reconstruction methods [Figs. 2(b), 2(e), and 2(f)2(j) and Fig. S2d in the Supplementary Material]. In contrast, pure DL-based methods led to reconstruction with fewer artifacts at the price of reduced resolution and decreased SSIM values. In addition, we often observed inaccurate inferences at the intersections of actin filaments and ER [yellow arrows in Figs. 2(c) and 2(e) and Fig. S2c in the Supplementary Material]. Together with the incorrectly inferred actin filaments at regions with extremely low fluorescence intensity (Fig. S3 in the Supplementary Material), these resembled the “hallucination effects” of pure DL methods,27 which was abolished by the TDV-SIM method. Furthermore, we compared TDV-SIM with rationalized DL (rDL) SIM29 on microtubule image from the BioSR25 data set (Fig. S4 in the Supplementary Material). By incorporating prior knowledge of illumination patterns into the DL network, rDL SIM aimed to denoise raw images rationally. Still, it produced punctated artifacts in background regions, which may be suppressed with a notch filter (NF) (white boxed region in Figs. S4(a) and S4(c) in the Supplementary Material). Moreover, we often observed microtubules within densely labeled regions absent from notch-filtered rDL SIM reconstructions (NF-rDL SIM; yellow arrows in Fig. S4b in the Supplementary Material), which was confirmed by the missing spikes in corresponding fluorescence profiles in the bottom. In comparison, TDV-SIM can avoid the missing signal problem of NF-rDL SIM and produce higher-fidelity reconstructions with fewer artifacts and higher SSIM [Figs. S4(b)–S4(d) in the Supplementary Material].

    TDV-SIM outperforms other reconstruction algorithms in suppressing artifacts and hallucinations while maintaining resolution. (a) Actin filaments under the SR-SIM. (b) Magnified views of the larger boxed region in panel (a) reconstructed by Wiener deconvolution, HiFi-SIM, Hessian-SIM, and TDV-SIM. The GT image is shown as the reference. Profiles along the yellow line are on the bottom. (c) Magnified views of the smaller boxed regions in panel (a) reconstructed by Wiener deconvolution, scU-Net, DFCAN, and TDV-SIM. The GT images are shown as references. (d) Time series imaging of ER under the SR-SIM (Video 1, MP4, 45 MB [URL: https://doi.org/10.1117/1.APN.2.1.016012.s1]). (e) Magnified views of the boxed regions in panel (d) reconstructed by Wiener deconvolution, HiFi-SIM, Hessian-SIM, scU-Net, DFCAN, and TDV-SIM. The GT images are shown as references. Artifact variances of actin filaments (f) or ER tubules (g) from background regions in different reconstructions (n=15 from three cells for each sample). Yellow arrowheads in panels (c) and (e) indicate the inaccurate reconstructions of pure DL-based methods. Red arrowheads in panel (e) highlight the artifacts of physical-model-based methods. SSIM of actin filaments (h) and ER tubules (i) in different reconstructions (n=150 and 15, respectively). (j) Resolutions of different reconstructions of actin filaments in panels (a)–(c) (n=14 from three cells). Scale bars: (a) and (d) 1 μm; (b) top, (c) and (e) 0.5 μm. (b) Bottom, axial: 0.2 arbitrary units (a.u.); lateral: 0.1 μm. Data are shown as mean ± SEM. p<0.05*, p<0.01**, p<0.001***, ns: not significant (one-way ANOVA).

    Figure 2.TDV-SIM outperforms other reconstruction algorithms in suppressing artifacts and hallucinations while maintaining resolution. (a) Actin filaments under the SR-SIM. (b) Magnified views of the larger boxed region in panel (a) reconstructed by Wiener deconvolution, HiFi-SIM, Hessian-SIM, and TDV-SIM. The GT image is shown as the reference. Profiles along the yellow line are on the bottom. (c) Magnified views of the smaller boxed regions in panel (a) reconstructed by Wiener deconvolution, scU-Net, DFCAN, and TDV-SIM. The GT images are shown as references. (d) Time series imaging of ER under the SR-SIM (Video 1, MP4, 45 MB [URL: https://doi.org/10.1117/1.APN.2.1.016012.s1]). (e) Magnified views of the boxed regions in panel (d) reconstructed by Wiener deconvolution, HiFi-SIM, Hessian-SIM, scU-Net, DFCAN, and TDV-SIM. The GT images are shown as references. Artifact variances of actin filaments (f) or ER tubules (g) from background regions in different reconstructions (n=15 from three cells for each sample). Yellow arrowheads in panels (c) and (e) indicate the inaccurate reconstructions of pure DL-based methods. Red arrowheads in panel (e) highlight the artifacts of physical-model-based methods. SSIM of actin filaments (h) and ER tubules (i) in different reconstructions (n=150 and 15, respectively). (j) Resolutions of different reconstructions of actin filaments in panels (a)–(c) (n=14 from three cells). Scale bars: (a) and (d) 1  μm; (b) top, (c) and (e) 0.5  μm. (b) Bottom, axial: 0.2 arbitrary units (a.u.); lateral: 0.1  μm. Data are shown as mean ± SEM. p<0.05*, p<0.01**, p<0.001***, ns: not significant (one-way ANOVA).

    3.2 TDV-SIM Enables Better Reconstruction of Intricate Structures Prone to Photobleaching

    Photobleaching constitutes a major problem of fluorescence SR imaging, continuously reducing image SNR, and compromising the quality of reconstructed images, especially upon resolving nonstereotypical structures such as mitochondrial cristae.30 Therefore, we benchmarked the performance of TDV-SIM in resolving mitochondrial cristae dynamics for a prolonged time in live cells [Fig. 3(a)]. During the 20 s recording, the fluorescence intensity of MitoTracker decreased by 30% due to photobleaching [Fig. 3(b)]. In the beginning, model-based methods could reconstruct high-quality intricate mitochondrial cristae, which were gradually corrupted with artifacts gradually due to photobleaching [Figs. 3(d)3(f)]. In contrast, although pure DL-based methods consistently generated fewer artifacts during the imaging period, they could not predict most cristae structures in the first place [Figs. 3(c), 3(e), and 3(f)]. Outperforming all other methods, TDV-SIM obtained sharp mitochondrial cristae structures with fewer artifacts and high SSIM with the GT, which persisted even under photobleaching conditions [Figs. 3(c)3(f)].

    TDV-SIM enables accurate reconstruction of intricate and dynamic mitochondrial cristae structures in live cells after prolonged bleaching. (a) Mitochondria under the SR-SIM. (b) Time-dependent bleaching in fluorescence intensities of mitochondria. (c) Magnified views of the larger boxed region in panel (a) reconstructed by scU-Net, DFCAN, and TDV-SIM and the corresponding GT image at 0 s. Profiles along the blue line are on the right. (d) Magnified views of the smaller boxed region in panel (a) reconstructed by Wiener deconvolution, HiFi-SIM, Hessian-SIM, and TDV-SIM and the corresponding GT images at 0, 15, and 20 s. (e) The SSIMs of regions enclosed mitochondria from different reconstructions compared to GT images at 0, 15, and 20 s (n=15). (f) Artifact variances of the background regions in different reconstructions at 0, 15, and 20 s (n=15). Scale bars: (a) 1 μm; (c) and (d) 0.5 μm. Data are shown as mean ± SEM. p<0.05*, p<0.01**, p<0.001***, ns: not significant (one-way ANOVA).

    Figure 3.TDV-SIM enables accurate reconstruction of intricate and dynamic mitochondrial cristae structures in live cells after prolonged bleaching. (a) Mitochondria under the SR-SIM. (b) Time-dependent bleaching in fluorescence intensities of mitochondria. (c) Magnified views of the larger boxed region in panel (a) reconstructed by scU-Net, DFCAN, and TDV-SIM and the corresponding GT image at 0 s. Profiles along the blue line are on the right. (d) Magnified views of the smaller boxed region in panel (a) reconstructed by Wiener deconvolution, HiFi-SIM, Hessian-SIM, and TDV-SIM and the corresponding GT images at 0, 15, and 20 s. (e) The SSIMs of regions enclosed mitochondria from different reconstructions compared to GT images at 0, 15, and 20 s (n=15). (f) Artifact variances of the background regions in different reconstructions at 0, 15, and 20 s (n=15). Scale bars: (a) 1  μm; (c) and (d) 0.5  μm. Data are shown as mean ± SEM. p<0.05*, p<0.01**, p<0.001***, ns: not significant (one-way ANOVA).

    3.3 TDV-SIM Enables Better Reconstruction of Actin Filaments under Nonlinear SIM

    In comparison to conventional linear SIM, nonlinear (NL) SIM achieves higher lateral resolution up to 60  nm,9 whereas NL-SIM suffers from the reconstruction artifacts, especially with low SNR raw data. By combining the NL-SIM physical model with the TDV regularization term, we proposed the TDV-NL-SIM. We benchmarked the performance of TDV-NL-SIM with Wiener deconvolution, Hessian-NL-SIM, and DFCAN on actin filaments within the BioSR data set25 [Fig. 4(a)]. Similar to the linear SIM circumstances, Hessian-NL-SIM provided improved reconstructions than Wiener deconvolution but still produced significant artifacts in background regions. In contrast, TDV-NL-SIM produced more continuous actin filaments [Figs. 4(c) and 4(f)] with fewer artifacts but comparable SSIM values to Hessian-NL-SIM [Figs. 4(b), 4(e), and 4(g)]. DFCAN led to reconstruction with comparable continuity but decreased SSIM values to TDV-NL-SIM [Figs. 4(f) and 4(g)]. And the inaccurate inferences of DFCAN at the actin filaments intersections can be avoided by the TDV-NL-SIM [yellow arrows in Fig. 4(d)].

    TDV-SIM enables better reconstruction of actin filaments under NL-SIM. (a) Actin filaments under the NL-SIM. (b), (c) Magnified views of the white boxed regions in panel (a) reconstructed by Wiener deconvolution, Hessian-SIM, DFCAN, and TDV-NL-SIM. The GT image is shown as the reference. Profiles along the yellow line are on the bottom. (d) Magnified views of the yellow boxed regions in panel (a) reconstructed by Wiener deconvolution, Hessian-SIM, DFCAN, and TDV-NL-SIM. The GT image is shown as the reference. Yellow arrowheads indicate the inaccurate reconstructions of pure DL-based methods. (e) Artifact variances of actin filaments from background regions in different reconstructions (n=20). (f) Signal variance along the actin filaments in different reconstructions (n=20). (g) SSIM of actin filaments in different reconstructions (n=20). Scale bars: (a) 1 μm; (b), (c) top and (d) 0.5 μm. (b), (c) Bottom, axial: 0.2 arbitrary units (a.u.); lateral: 0.1 μm. Data are shown as mean ± SEM. p<0.01**, p<0.001***, ns: not significant (one-way ANOVA).

    Figure 4.TDV-SIM enables better reconstruction of actin filaments under NL-SIM. (a) Actin filaments under the NL-SIM. (b), (c) Magnified views of the white boxed regions in panel (a) reconstructed by Wiener deconvolution, Hessian-SIM, DFCAN, and TDV-NL-SIM. The GT image is shown as the reference. Profiles along the yellow line are on the bottom. (d) Magnified views of the yellow boxed regions in panel (a) reconstructed by Wiener deconvolution, Hessian-SIM, DFCAN, and TDV-NL-SIM. The GT image is shown as the reference. Yellow arrowheads indicate the inaccurate reconstructions of pure DL-based methods. (e) Artifact variances of actin filaments from background regions in different reconstructions (n=20). (f) Signal variance along the actin filaments in different reconstructions (n=20). (g) SSIM of actin filaments in different reconstructions (n=20). Scale bars: (a) 1  μm; (b), (c) top and (d) 0.5  μm. (b), (c) Bottom, axial: 0.2 arbitrary units (a.u.); lateral: 0.1  μm. Data are shown as mean ± SEM. p<0.01**, p<0.001***, ns: not significant (one-way ANOVA).

    4 Discussion

    For traditional reconstruction methods such as Hessian-SIM, the denoising effect is limited to images with a low SNR. In contrast, the pure DL method directly fits the SR image through raw images, in which the fitting process is a black box. Therefore, reconstruction fidelity entirely depends on the network fitting ability and its comparativeness with the sample. For the proposed TDV-SIM, the SR information is extracted from raw images by the conventional frequency-extracting process and then integrated into the TDV network for artifact suppression. By combining the advantages of conventional physical model-based algorithms with DL-based algorithms, TDV-SIM outperforms existing reconstruction methods in removing artifacts associated with regions of low SNR while retaining sharp-contrast intricate structures. For example, the reconstructed actin filaments and ER of TDV-SIM have an 80.1% decrease in the background artifacts compared with Hessian-SIM and a 24.3% increase in signal fidelity compared with DFCAN. Indeed, all current DL-based reconstruction methods generate blurred mitochondrial cristae structures,24,25 highlighting the difficulty of pure data-driven methods in predicting irregular and complicated structures in constant changes. Under such circumstances, incorporating physical constraints about the image formation process becomes critical, as we show here. Therefore, TDV-SIM has significant advantages over pure DL methods in the face of samples with intricate and dynamic structures.

    However, the current TDV-SIM has limitations. On the one hand, inherited from conventional restoration algorithms, better reconstruction results depend on choosing ideal parameters. Through comparative experiments, we set the optimal hyperparameters to be 2.5 and 25 for λ and T respectively, which are applicable in most cases. However, we may need to introduce adaptive mechanisms to achieve an optimized adjustment step in the future. On the other hand, we cannot apply the current neural network regularization term to different specimens and imaging modalities. Future exploration of other regularization terms more generally applicable to different samples may further improve the adaptability and robustness of our method. Besides, TDV-SIM aims to recover the real signal from the noisy raw images. In the second-order spectrum of NL-SIM, excess noise renders signals in the reconstructed SR image to be discontinued, even with the TDV-SIM. However, it will not produces hallucinative signals such as the pure DL method.

    Starting from a hybrid angle, TDV-SIM presents a novel solution for high-resolution and HiFi SR-SIM reconstruction from low SNR images. Endorsed with reduced photon dosage and associated phototoxicity, improved imaging speed, and extended imaging duration, TDV-SIM will be crucial for SR imaging subcellular structure dynamics in live cells.

    Jianyong Wang received his bachelor’s degree in mechanical design, manufacturing, and automation from the University of Electronic Science and Technology of China in 2019 and his master’s degree in software engineering from the School of Software and Microelectronics of Peking University in 2022. His research interest is super-resolution structured illumination microscopy.

    Junchao Fan received his bachelor’s and PhD degrees in engineering from Huazhong University of Science and Technology in 2014 and 2020, respectively. He is an associate professor at Chongqing University of Posts and Telecommunications. His research is focused on the imaging processing and reconstruction algorithm of computational imaging.

    Bo Zhou received his bachelor’s degree in mechanical design, manufacturing, and automation from Central South University in 2017 and his master’s degree in software engineering from the School of Software and Microelectronics, Peking University in 2020. Currently, he is a PhD student at Cell Secretion and Metabolism Laboratory, Institute of Molecular Medicine, Peking University. His research interests are the reconstruction algorithms of super-resolution fluorescence microscopy.

    Xiaoshuai Huang received his bachelor’s degree in science from Wuhan University in 2013 and his PhD from Peking University in 2018. He is an assistant professor at Peking University. From 2018 to 2020, he was trained as a postdoctoral research fellow at Peking University. His research is focused on super-resolution microscopy and cell biology.

    Liangyi Chen is a Boya Professor at Peking University. He majored in biomedical engineering as an undergraduate at Xi’an JiaoTong University and a PhD student at Huazhong University of Science and Technology. His lab focused on developing state-of-the-art imaging techniques, including ultrasensitive Hessian structured illumination microscopy, super-resolution fluorescence-assisted diffraction computational tomography, sparse deconvolution enabled mathematical superresolution, and fast high-resolution miniature two-photon microscopy for brain imaging in freely behaving mice. He is also a guest professor at Université PSL and École Normale Supérieure.

    References

    [1] S. W. Hell. Far-field optical nanoscopy. Science, 316, 1153-1158(2007).

    [2] S. T. Hess et al. Dynamic clustered distribution of hemagglutinin resolved at 40 nm in living cell membranes discriminates between raft theories. Proc. Natl. Acad. Sci. U. S. A., 104, 17370-17375(2007).

    [3] B. Huang, M. Bates, X. Zhuang. Super-resolution fluorescence microscopy. Annu. Rev. Biochem., 78, 993-1016(2009).

    [4] L. Schermelleh, R. Heintzmann, H. Leonhardt. A guide to super-resolution fluorescence microscopy. J. Cell Biol., 190, 165-175(2010).

    [5] P. Sengupta, S. Van Engelenburg, J. Lippincott-Schwartz. Visualizing cell structure and function with point-localization superresolution imaging. Dev. Cell, 23, 1092-1102(2012).

    [6] J. Nixon-Abell et al. Increased spatiotemporal resolution reveals highly dynamic dense tubular matrices in the peripheral ER. Science, 354, aaf3928(2016).

    [7] W. Shin et al. Visualization of membrane pore in live cells reveals a dynamic-pore theory governing fusion and endocytosis. Cell, 173, 934-945.e12(2018).

    [8] P. P. Laissue et al. Assessing phototoxicity in live fluorescence imaging. Nat. Methods, 14, 657-661(2017).

    [9] D. Li et al. ADVANCED IMAGING. Extended-resolution structured illumination imaging of endocytic and cytoskeletal dynamics. Science, 349, aab3500(2015).

    [10] M. G. Gustafsson. Surpassing the lateral resolution limit by a factor of two using structured illumination microscopy. J. Microsc., 198, 82-87(2000).

    [11] M. G. Gustafsson et al. Three-dimensional resolution doubling in wide-field fluorescence microscopy by structured illumination. Biophys. J., 94, 4957-4970(2008).

    [12] G. E. Cragg, P. T. So. Lateral resolution enhancement with standing evanescent waves. Opt. Lett., 25, 46-48(2000).

    [13] P. Kner et al. Super-resolution video microscopy of live cells by structured illumination. Nat. Methods, 6, 339-342(2009).

    [14] L. M. Hirvonen et al. Structured illumination microscopy of a living cell. Eur. Biophys. J., 38, 807-812(2009).

    [15] Y. Guo et al. Visualizing intracellular organelle and cytoskeletal interactions at nanoscale resolution on millisecond timescales. Cell, 175, 1430-1442.e17(2018).

    [16] A. Lal, C. Shan, P. Xi. Structured illumination microscopy image reconstruction algorithm. IEEE J. Sel. Top. Quantum Electron., 22, 50-63(2016).

    [17] M. Müller et al. Open-source image reconstruction of super-resolution structured illumination microscopy data in ImageJ. Nat. Commun., 7, 10980(2016).

    [18] X. Huang et al. Fast, long-term, super-resolution imaging with Hessian structured illumination microscopy. Nat. Biotechnol., 36, 451-459(2018).

    [19] K. Chu et al. Image reconstruction for structured-illumination microscopy with low signal level. Opt. Express, 22, 8687-8702(2014).

    [20] G. Wen et al. High-fidelity structured illumination microscopy by point-spread-function engineering. Light Sci. Appl., 10, 70(2021).

    [21] W. Zhaojun et al. High-speed image reconstruction for optically sectioned, super-resolution structured illumination microscopy. Adv. Photonics, 4, 026003(2022).

    [22] Y. Mo et al. Structured illumination microscopy artefacts caused by illumination scattering. Philos. Trans. A Math. Phys. Eng. Sci., 379, 20200153(2021).

    [23] K. Hornik, M. Stinchcombe, H. White. Multilayer feedforward networks are universal approximators. Neural Netw., 2, 359-366(1989).

    [24] L. Jin et al. Deep learning enables structured illumination microscopy with low light levels and enhanced speed. Nat. Commun., 11, 1934(2020).

    [25] C. Qiao et al. Evaluation and development of deep neural networks for image super-resolution in optical microscopy. Nat. Methods, 18, 194-202(2021).

    [26] C. N. Christensen et al. ML-SIM: universal reconstruction of structured illumination microscopy images using transfer learning. Biomed. Opt. Express, 12, 2720-2733(2021).

    [27] S. Bhadra et al. On hallucinations in tomographic image reconstruction. IEEE Trans. Med. Imaging, 40, 3249-3260(2021).

    [28] E. Kobler et al. Total deep variation for linear inverse problems, 7546-7555(2020).

    [29] C. Qiao et al. Rationalized deep learning super-resolution microscopy for sustained live imaging of rapid subcellular processes. Nat. Biotechnol., 2022, 1-11(2022).

    [30] S. Jakobs, C. A. Wurm. Super-resolution microscopy of mitochondria. Curr. Opin. Chem. Biol., 20, 9-15(2014).

    Jianyong Wang, Junchao Fan, Bo Zhou, Xiaoshuai Huang, Liangyi Chen. Hybrid reconstruction of the physical model with the deep learning that improves structured illumination microscopy[J]. Advanced Photonics Nexus, 2023, 2(1): 016012
    Download Citation