• Spectroscopy and Spectral Analysis
  • Vol. 42, Issue 9, 2947 (2022)
Rui LI1、1;, Bo LI1、1; *;, Xue-wen WANG1、1;, Tao LIU1、1;, Lian-jie LI1、1; 2;, and Shu-xiang FAN2、2;
Author Affiliations
  • 11. College of Mechanical and Vehicle Engineering, Taiyuan University of Technology, Taiyuan 030024, China
  • 22. Beijing Research Center of Intelligent Equipment for Agriculture, Beijing 100097, China
  • show less
    DOI: 10.3964/j.issn.1000-0593(2022)09-2947-09 Cite this Article
    Rui LI, Bo LI, Xue-wen WANG, Tao LIU, Lian-jie LI, Shu-xiang FAN. A Classification Method of Coal and Gangue Based on XGBoost and Visible-Near Infrared Spectroscopy[J]. Spectroscopy and Spectral Analysis, 2022, 42(9): 2947 Copy Citation Text show less
    Coal samples (a, c, e) and gangue samples (b, d, f) from different coal mines(a), (b): Ximing coal mine; (c), (d): Shenmu coal mine; (e), (f): Balongtu coal mine
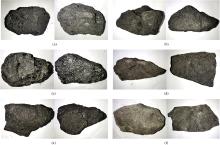
    Fig. 1. Coal samples (a, c, e) and gangue samples (b, d, f) from different coal mines
    (a), (b): Ximing coal mine; (c), (d): Shenmu coal mine; (e), (f): Balongtu coal mine
    Visible and near-infrared spectroscopy collection system
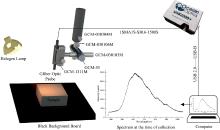
    Fig. 2. Visible and near-infrared spectroscopy collection system
    Spectra of coal and gangue in Ⅰ: (a)(b), Ⅱ: (c)(d), Ⅲ: (e)(f) mines after pretreatment
    Fig. 3. Spectra of coal and gangue in Ⅰ: (a)(b), Ⅱ: (c)(d), Ⅲ: (e)(f) mines after pretreatment
    The process of variable selection by RFE
    Fig. 4. The process of variable selection by RFE
    The process of variable selection by SPA
    Fig. 5. The process of variable selection by SPA
    The process of variable selection by CARS
    Fig. 6. The process of variable selection by CARS
    The variables selection process of the test group by RFE
    Fig. 7. The variables selection process of the test group by RFE
    产地及煤矿样品类别
    及编号
    外观特征样品
    数量
    采集光
    谱数量
    山西西铭(Ⅰ)煤(Ⅰ.1)黑色, 有光泽93169
    岩(Ⅰ.2)黑色, 无光泽91169
    陕西神木(Ⅱ)煤(Ⅱ.1)黑色, 有光泽2039
    岩(Ⅱ.2)黑褐色, 无光泽1833
    内蒙古巴隆图(Ⅲ)煤(Ⅲ.1)黑褐色, 无光泽2649
    岩(Ⅲ.2)灰白色, 无光泽2343
    Table 1. Samples information
    Sample
    origin
    Number of
    variables
    ModelACC10ACCAUC
    1 000KNN0.948 50.941 10.941 5
    RF0.953 00.960 70.961 1
    SVM0.944 30.960 70.961 1
    XGBoost0.957 20.970 50.971 6
    Table 2. Comparison of different classification models based on the full-band spectra
    Sample
    origin
    Variable selection
    methods
    Number of
    variables
    ModelACC10ACCAUC
    RFE9KNN0.948 30.950 90.950 9
    RF0.948 30.950 90.952 0
    SVM0.956 80.960 70.952 0
    XGBoost0.965 70.980 30.980 3
    SPA5KNN0.953 00.950 90.951 2
    RF0.953 00.960 70.960 7
    SVM0.965 70.960 70.961 1
    XGBoost0.957 20.960 70.960 7
    CARS61KNN0.957 00.950 90.951 2
    RF0.948 90.950 90.950 9
    SVM0.978 60.980 30.980 3
    XGBoost0.961 50.960 70.960 7
    Table 3. The prediction results of different classification models based on characteristic wavelengths
    ModelSample
    origin
    Variable selection
    methods
    Number of
    variables
    ACC10ACCAUC
    XGBoostRFE1 0000.955 01.000 01.000 0
    30.975 01.000 01.000 0
    RFE1 0000.940 40.964 20.968 7
    70.954 71.000 01.000 0
    Table 4. The model prediction results of the test group
    Rui LI, Bo LI, Xue-wen WANG, Tao LIU, Lian-jie LI, Shu-xiang FAN. A Classification Method of Coal and Gangue Based on XGBoost and Visible-Near Infrared Spectroscopy[J]. Spectroscopy and Spectral Analysis, 2022, 42(9): 2947
    Download Citation