
Guolin Ma, Jianli Ding, Zipeng Zhang. Soil Organic Matter Content Estimation Based on Soil Covariate and VIS-NIR Spectroscopy[J]. Laser & Optoelectronics Progress, 2020, 57(19): 192801
- Laser & Optoelectronics Progress
- Vol. 57, Issue 19, 192801 (2020)
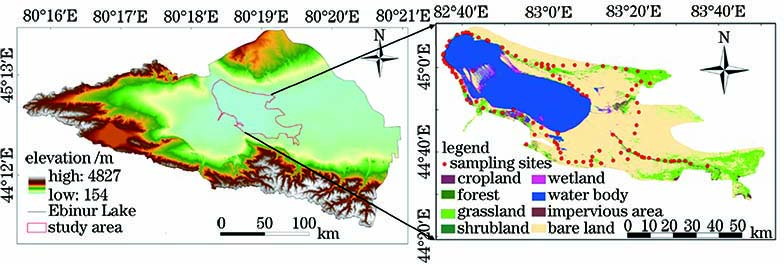
Fig. 1. Distribution of the study area and sampling points
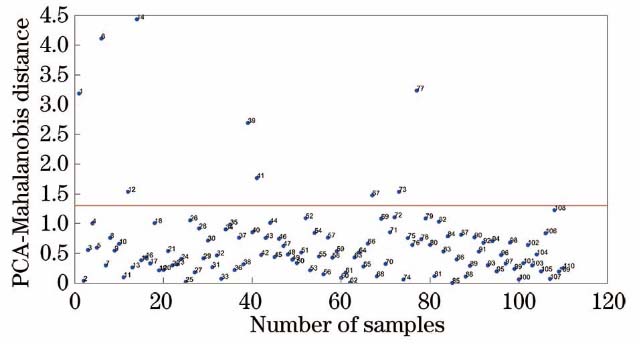
Fig. 2. PCA-Mahalanobis distance distribution
Fig. 3. Original spectra and the pretreated soil spectral reflectance curves. (a) Original spectral reflectance; (b) spectral reflectance after SG smoothing; (c) spectral reflectance corrected for multiple scattering; (d) spectral reflectance treated with first order differentiation
Fig. 4. Contribution diagram of the first 10 variables. (a) Original spectral reflectance; (b) spectral reflectance after SG-MSC treatments; (c) spectral reflectance after SG-MSC-FD treatments
Fig. 5. Comparison of soil organic matter prediction variables
Fig. 6. Correlation between different soil parameters (n=101), in which the curves are fitting curves
Fig. 7. Correlation between SOM, EC, Fe and pH and original spectral reflectance (n=101)
Fig. 8. Correlation between soil organic matter and the first five principal components for original spectrum and preprocessed spectra under two spectral treatments of SG-MSC and SG-MSC-FD
Fig. 9. Fitting scatter diagrams of PLSR model under three strategies. (a) Model 1; (b) model 2; (c) model 3; (d) model 4; (e) model 5; (f) model 6; (g) model 7
Fig. 10. VIP values of prediction variables in different PLSR models. (a) Model 3; (b) model 4; (c) model 5
|
Table 1. Statistical characteristics of soil properties
| ||||||||||||||||||||||||||||||||||||||||||||||||||||||||||||||||||
Table 2. PLSR modeling results under three strategies

Set citation alerts for the article
Please enter your email address
© Copyright 2018-2021 | Chinese Laser Press. All Rights Reserved 沪ICP备15018463号-20