
Liangfeng Chen, Zhongping Lee, Gong Lin, Yongchao Wang, Junwei Wang, Wendian Lai. Experimental Evaluation of Temperature Dependence of Pure Water Absorption Coefficient in Near-Infrared Domain[J]. Acta Optica Sinica, 2022, 42(18): 1801007
- Acta Optica Sinica
- Vol. 42, Issue 18, 1801007 (2022)
Abstract
1 Introduction
The spectral absorption coefficient of pure water[aw,cm-1]is a basic inherent optical property(IOP)[
Many studies in the past have shown that the aw has two distinct characteristics. On the one hand,the values of aw vary enormously from UV-visible to near-infrared,spanning several orders of magnitude[
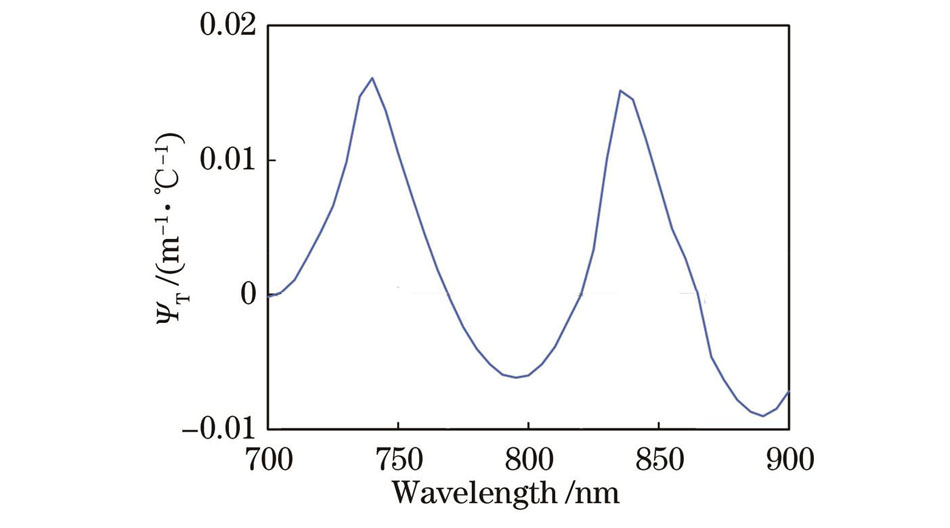
Further,it has also been indicated that the values of aw depend on environmental influences,such as temperature(T)and salinity[
![]()
Figure 1.Temperature correction coefficient ΨT for aw obtained from Rottgers et al.[
Laboratory measurement of aw is not an easy task[
In this study,to avoid the above-mentioned difficulties in laboratory measurements,we use remote-sensing reflectance [Rrs(λ),sr-1]of highly turbid waters in the NIR to analyze the response of aw to different temperatures. This is based on that Rrs is in general a function of bb/(a+bb),where bb is the total backscattering coefficient and a is the total absorption coefficient. For the NIR domain,the absorption coefficient of gelbstoff can be ignored,and a can be expressed as the following after considering T-dependent aw,
where
where bbp is the backscattering coefficient of suspended particles,while G is the model coefficient,which in the first order approximates 0.05 sr-1. In the NIR domain,the spectral shapes of both ap and bbp are flat and do not show spectrally selective temperature dependences. Thus if the dependence of aw in NIR at difference wavelengths is opposite,we should expect to see a twist of Rrs spectral shapes in the NIR(740-850 nm here,more specifically).
To analyze this response of aw on temperature,we thus carried out controlled experiments to measure hyperspectral Rrs of very turbid waters at different temperatures. A high turbidity is required to obtain adequate Rrs measurements in the NIR domain,where the values of aw are very high[
2 Methods and Setups
2.1 Measurement Setups
To evaluate the impact of temperature on aw in the NIR(740-850 nm)domain,we designed an outdoor experimental system to measure Rrs
![]()
Figure 2.Photo of the water-filled tank along with the radiometer when taking measurement of Lt via above-water approach (AWA)
The temperature of this water-sediment mixture was adjusted by adding a large number of crushed ice cubes and heating rods,which resulted in a temperature range of 7 to 51 ℃. The temperature of the water body was measured simultaneously from five different spots near the surface when radiometric measurements were taken,where the temperature resolution was 0.1 ℃,which is sufficient for this study. An average of the temperature readings from the five spots was used to represent the temperature for each set of radiometric measurements.
The experiments were carried out on 4 Decemberand 13 December,2021 between 10:00 and 14:00,under cloudless blue-sky day and low wind. The impacts of the tank wall and tank bottom on the water-leaving radiance at the center of this tank are negligible as the Secchi disk depth is ∼0.15 m after adding high loads of sediments into such lake waters.
2.2 Instrument and Approach to Measure Rrs
To obtain Rrs in the NIR,the spectrometer(SE SR1901)of Spectral Evolution(USA)was used to collect the required radiance. SE SR1901 has a wavelength range of 280-1900 nm,with a spectral resolution of ~2 nm and a field of view of 4°. The spectrometer has two probes,one is with a cosine collector used for measuring downwelling irradiance,the other is used for measuring radiance,and both are factory calibrated where their equivalent radiation noises are orders lower than the radiance to be measured in this study. In order to avoid potential mismatch in radiometric and spectral calibrations between the two probes,we just used the probe for radiance,and the downwelling irradiance was calculated from measuring the radiance reflected from a standard gray card,which has a reflectance of 20%.
For such controlled environment,we took the AWA[
where ρ is the reflectance(0.2)of the gray card,F is the Fresnel reflectance of the air-sea surface and takes a value of 0.023 because we restrict the measurements to cloudless and calm water conditions. Δ reflects a residual correction of surface-reflected radiance that might not be completely corrected from the subtraction of FLsky,and is determined by setting the average value of Rrs(1600-1650 nm)to 0 based on Lee et al.[
2.3 Measurement
We first added a large amount of crushed ice to the turbidity water. Gentle stirring was carried out to make the ice melted and the water well mixed. After no floating ice visible on the water surface,we recorded the temperature and measured Lt,Lsky,and Lplaque in turn via AWA. Each property was measured 10 times to ensure stable and reliable data. After that,the water was gradually warmed,and generally it took ~40 minutes for each increase of 10 ℃. The temperature range of liquid water in the nature environment is about -2-30 ℃,but we expand the higher end to 51 ℃ in order to more clearly observe the impact of temperature on aw. Finally,we took radiometric measurements at 14 different temperatures,which were 7,10,12,15,17,20,25,27,29,32,37,42,47,and 51 ℃. For each temperature scale,it took approximately 2 minutes to complete the measurement cycle,where the ambient light field could be considered stable and the variation of water temperature was within ~0.5 ℃,and thus it is appropriate to consider these measurements were completed under the “same” environmental conditions and the “same” temperature.
In addition,we also collected water samples from the surface to measure the IOPs of the water-sediment mixture,which include the absorption coefficients of suspended particles(ap)and gelbstoff(ag)that corresponding to each set of Rrsmeasurement at different temperatures. The absorption coefficients of the water samples were all measured with a dual-beam PE Lambda 950 spectrophotometer equipped with an integrating sphere(150 mm in diameter)in the laboratory. The spectrum of ap was measured by the transmittance-reflectance(T-R)method[
3 Results and Discussion
3.1 Rrs of Tank Waters
The resulted Rrs spectra at different temperatures obtained on 4 December,2021 are presented in
![]()
Figure 3.Rrs spectra at different temperatures obtained in this study. (a) Measured on 4 December, 2021; (b) measured on 13 December, 2021
![]()
Figure 4.ap spectra of the water-sediment mixture at different temperature (or time) of this study
3.2 Relationship Between Rrs(NIR)Spectral Shape and Temperature
To highlight the variation of Rrs spectral shape in the NIR,all Rrs spectra under different T are normalized to Rrs(770),represented as Rrs_Nor(λ):
The reason to select 770 nm as the reference point is that aw(770)is insensitive to T(see
![]()
Figure 5.Normalized Rrs spectra Rrs_Nor at different temperatures
The opposite responses of Rrs(λ1)and Rrs(λ2)to the change of T were further quantitatively analyzed by the relative difference(
For comparison,we also calculated the relative difference between aw(λ1)and aw(λ2)(
where the values of aw(λi,T0)(i=1,2)were taken from Kou et al.[
![]()
Figure 6.Relationship between
The opposite relationships with T for
Similar results were found for
![]()
Figure 7.Relationship between
Because Rrs is also related to bbp and ap(see
![]()
Figure 8.Change of
4 Conclusions
From the measured Rrs of highly turbid waters under different temperature,it is clear that the change of spectral curvature of Rrs in the 740-850 nm range is driven by the spectrally varying change of aw at different temperatures. More importantly,this change in Rrs shape is consistent with that predicted by the latest laboratory measurements of Rottgers et al.[
References
[1] Preisendorfer R W[M]. Hydrologic optics(1976).
[2] Sullivan J M, Twardowski M S, Zaneveld J R V et al. Hyperspectral temperature and salt dependencies of absorption by water and heavy water in the 400-750 nm spectral range[J]. Applied Optics, 45, 5294-5309(2006).
[3] Moore C C. WET labs ac-9: field calibration protocol, deployment techniques, data processing, and design improvements[J]. Proceedings of SPIE, 2963, 1-6(1997).
[4] Gordon H R. Removal of atmospheric effects from satellite imagery of the oceans[J]. Applied Optics, 17, 1631-1636(1978).
[5] Wei G M, Lee Z P, Wu X L et al. Impact of temperature on absorption coefficient of pure seawater in the blue wavelengths inferred from satellite and in situ measurements[J]. Journal of Remote Sensing, 289-301(2021).
[6] Lee Z P, Shang S L, Lin G et al. On the modeling of hyperspectral remote-sensing reflectance of high-sediment-load waters in the visible to shortwave-infrared domain[J]. Applied Optics, 55, 1738-1750(2016).
[7] Morel A[J]. Optical properties of pure water and pure sea water, 1-24(1974).
[8] Buiteveld H, Hakvoort J, Donze M. Optical properties of pure water[J]. Proceedings of SPIE, 2258, 1-10(1994).
[9] Lee Z P, Wei J W, Voss K et al. Hyperspectral absorption coefficient of “pure” seawater in the range of 350-550 nm inverted from remote sensing reflectance[J]. Applied Optics, 54, 546-558(2015).
[10] Patel C K N, Tam A C. Optical absorption coefficients of water[J]. Nature, 280, 302-304(1979).
[11] Querry M R, Cary P G, Waring R C. Split-pulse laser method for measuring attenuation coefficients of transparent liquids: application to deionized filtered water in the visible region[J]. Applied Optics, 17, 3587-3592(1978).
[12] Pope R M, Fry E S. Absorption spectrum (380-700 nm) of pure water. II. Integrating cavity measurements[J]. Applied Optics, 36, 8710-8723(1997).
[13] Mason J D, Cone M T, Fry E S. Ultraviolet (250-550 nm) absorption spectrum of pure water[J]. Applied Optics, 55, 7163-7172(2016).
[14] Röttgers R, McKee D, Utschig C. Temperature and salinity correction coefficients for light absorption by water in the visible to infrared spectral region[J]. Optics Express, 22, 25093-25108(2014).
[15] Pegau W S, Gray D, Zaneveld J R. Absorption and attenuation of visible and near-infrared light in water: dependence on temperature and salinity[J]. Applied Optics, 36, 6035-6046(1997).
[16] Pegau W S, Zaneveld J R V. Temperature dependence of the absorption coefficient of pure water in the visible portion of the spectrum[J]. Proceedings of SPIE, 2258, 597-604(1994).
[17] Langford V S, McKinley A J, Quickenden T I. Temperature dependence of the visible-near-infrared absorption spectrum of liquid water[J]. The Journal of Physical Chemistry A, 105, 8916-8921(2001).
[18] Quickenden T I, Irvin J A. The ultraviolet absorption spectrum of liquid water[J]. The Journal of Chemical Physics, 72, 4416-4428(1980).
[19] Gordon H R, Brown O B, Evans R H et al. A semianalytic radiance model of ocean color[J]. Journal of Geophysical Research: Atmospheres, 93, 10909-10924(1988).
[20] Nechad B, Ruddick K G, Park Y. Calibration and validation of a generic multisensor algorithm for mapping of total suspended matter in turbid waters[J]. Remote Sensing of Environment, 114, 854-866(2010).
[21] Kou L, Labrie D, Chylek P. Refractive indices of water and ice in the 0.65- to 2.5-µm spectral range[J]. Applied Optics, 32, 3531-3540(1993).
[22] Mobley C D. Estimation of the remote-sensing reflectance from above-surface measurements[J]. Applied Optics, 38, 7442-7455(1999).
[23] Mueller J L[M]. Ocean optics protocols for satellite ocean color sensor validation, revision 4: radiometric measurements and data analysis protocols(2003).
[24] Mueller J L, Davis C, Arnone R et al. Above-water radiance and remote sensing reflectance measurement and analysis protocols[J]. Radiometric Measurements and Data Analysis, 4, 21-30(2003).
[25] Lee Z P, Ahn Y H, Mobley C et al. Removal of surface-reflected light for the measurement of remote-sensing reflectance from an above-surface platform[J]. Optics Express, 18, 26313-26324(2010).
[26] Tassan S, Ferrari G M. Variability of light absorption by aquatic particles in the near-infrared spectral region[J]. Applied Optics, 42, 4802-4810(2003).
[27] Kiefer D A, SooHoo J B. Spectral absorption by marine particles of coastal waters of Baja California[J]. Limnology and Oceanography, 27, 492-499(1982).
[28] Bricaud A, Morel A, Prieur L. Absorption by dissolved organic matter of the sea (yellow substance) in the UV and visible domains[J]. Limnology and Oceanography, 26, 43-53(1981).


Set citation alerts for the article
Please enter your email address

© Copyright 2018-2021 | Chinese Laser Press. All Rights Reserved 沪ICP备15018463号-20