Author Affiliations
1Graduate School, Air Force Engineering University, Xi'an, Shaanxi 710038, China2Aeronautics Engineering College, Air Force Engineering University, Xi'an, Shaanxi 710038, Chinashow less
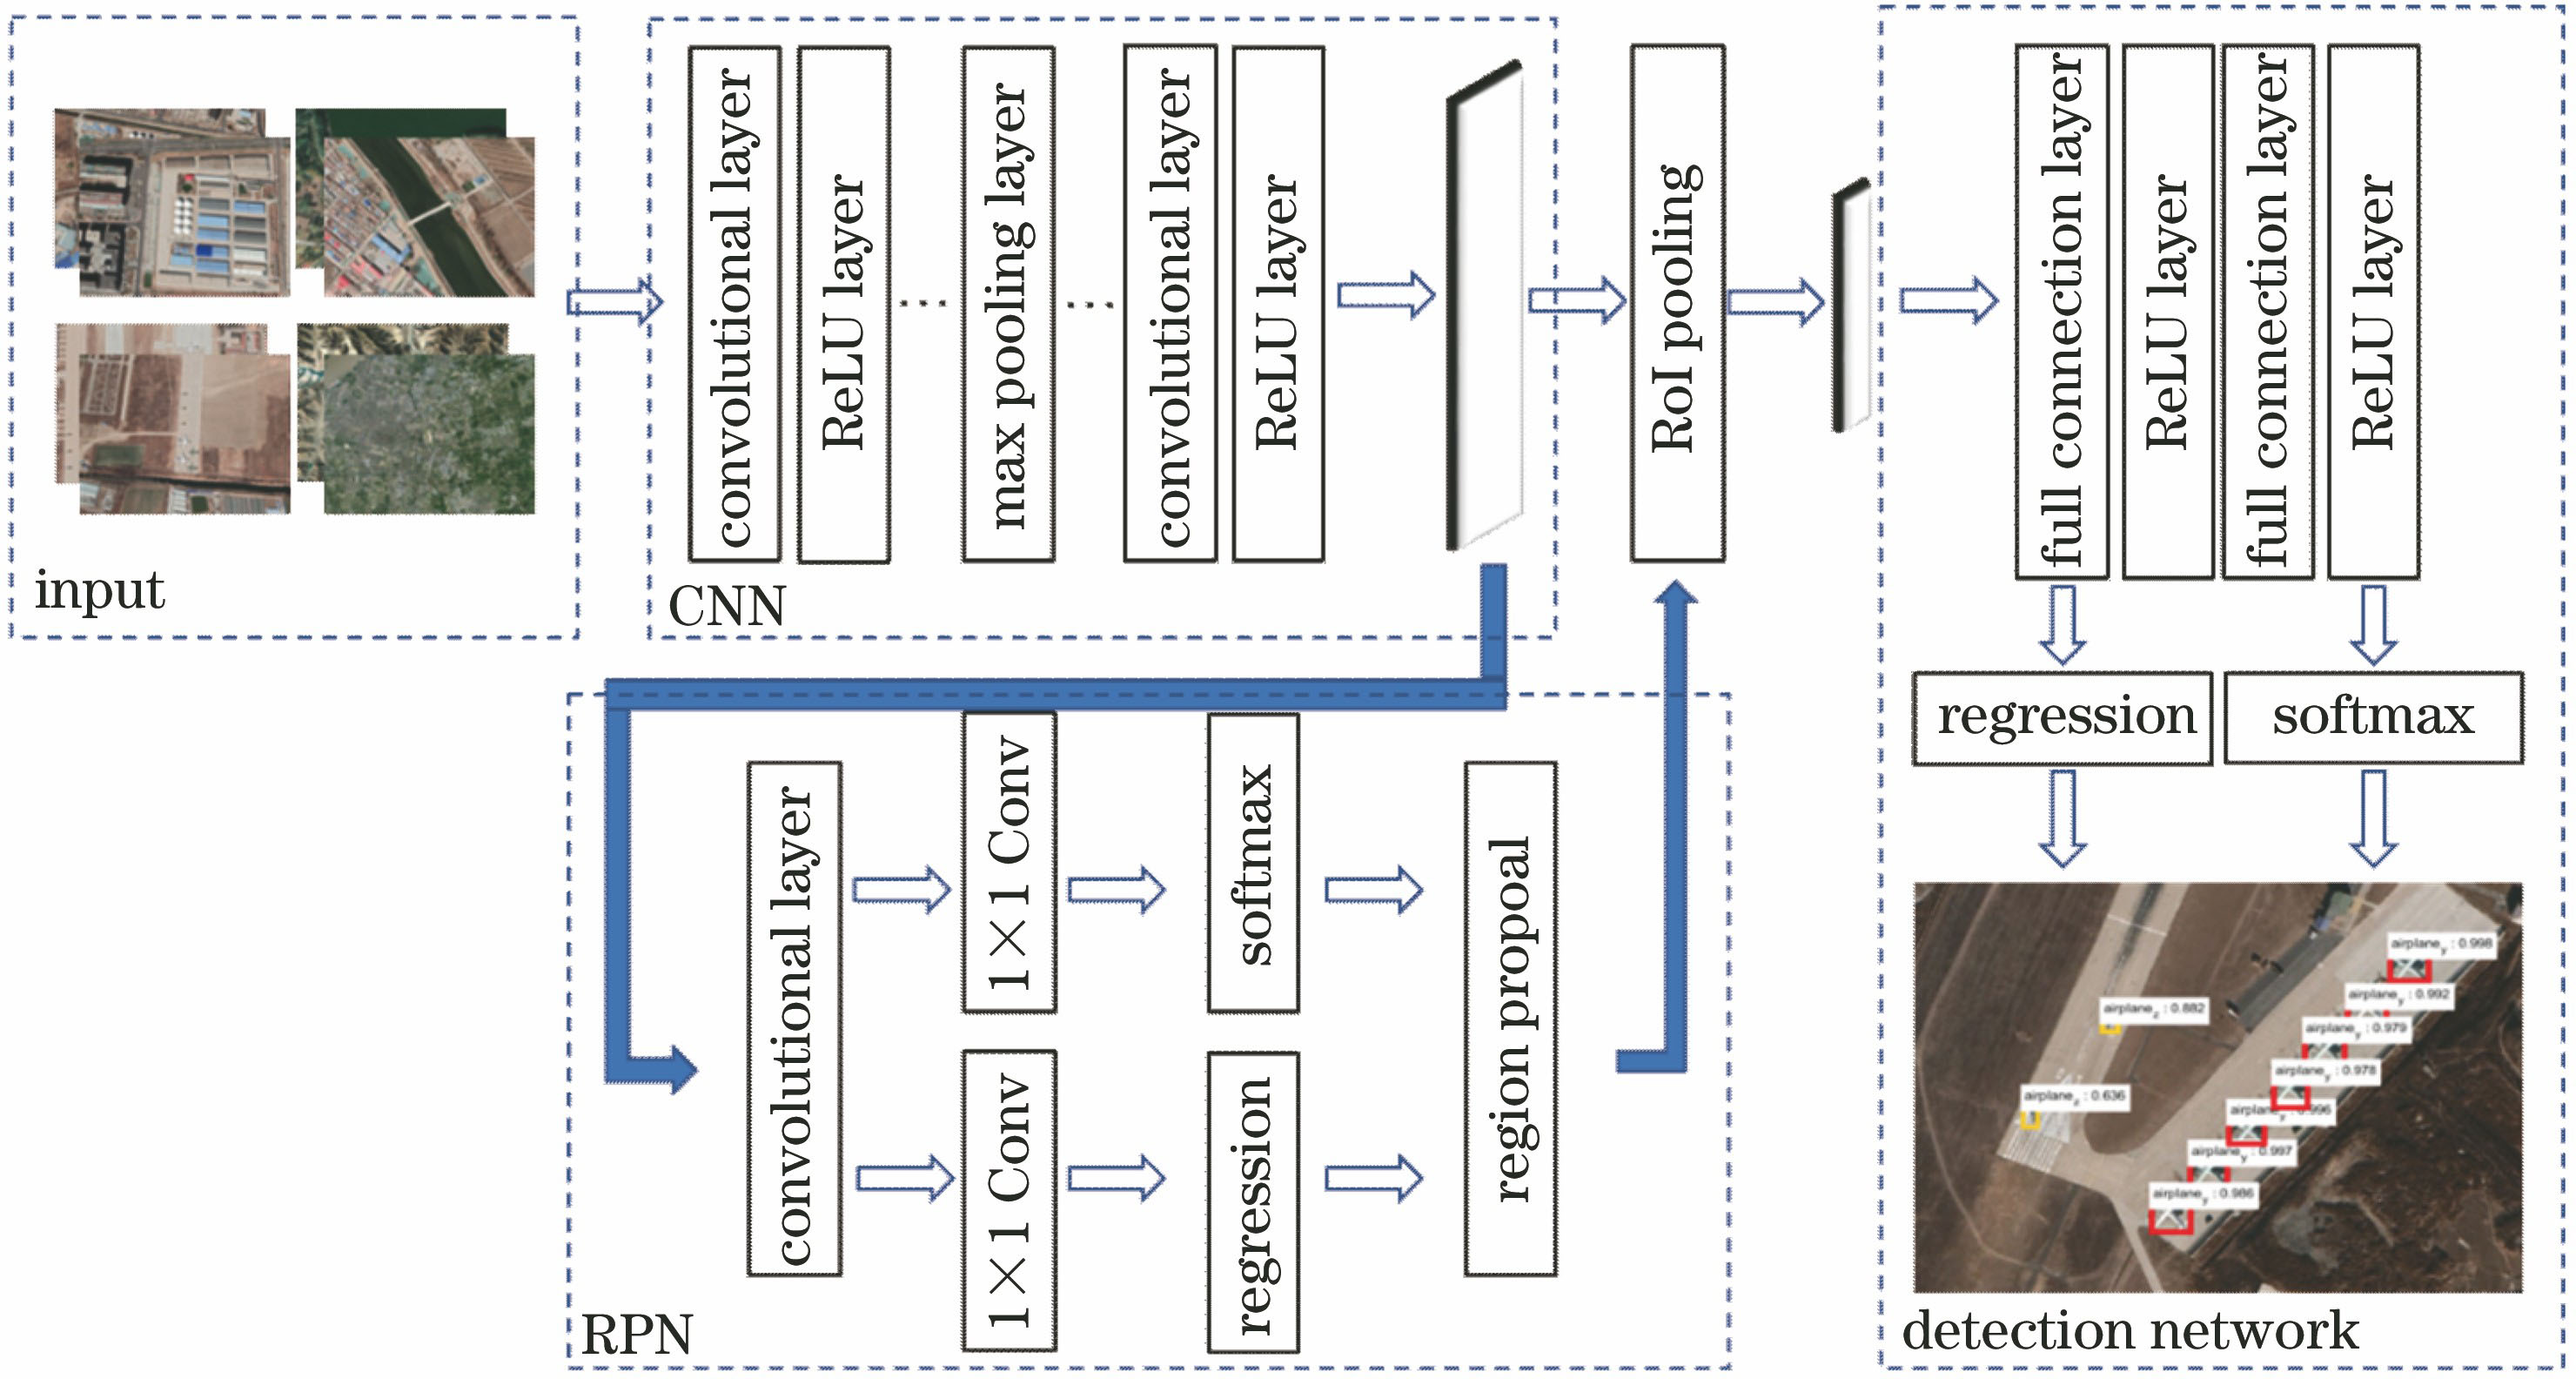
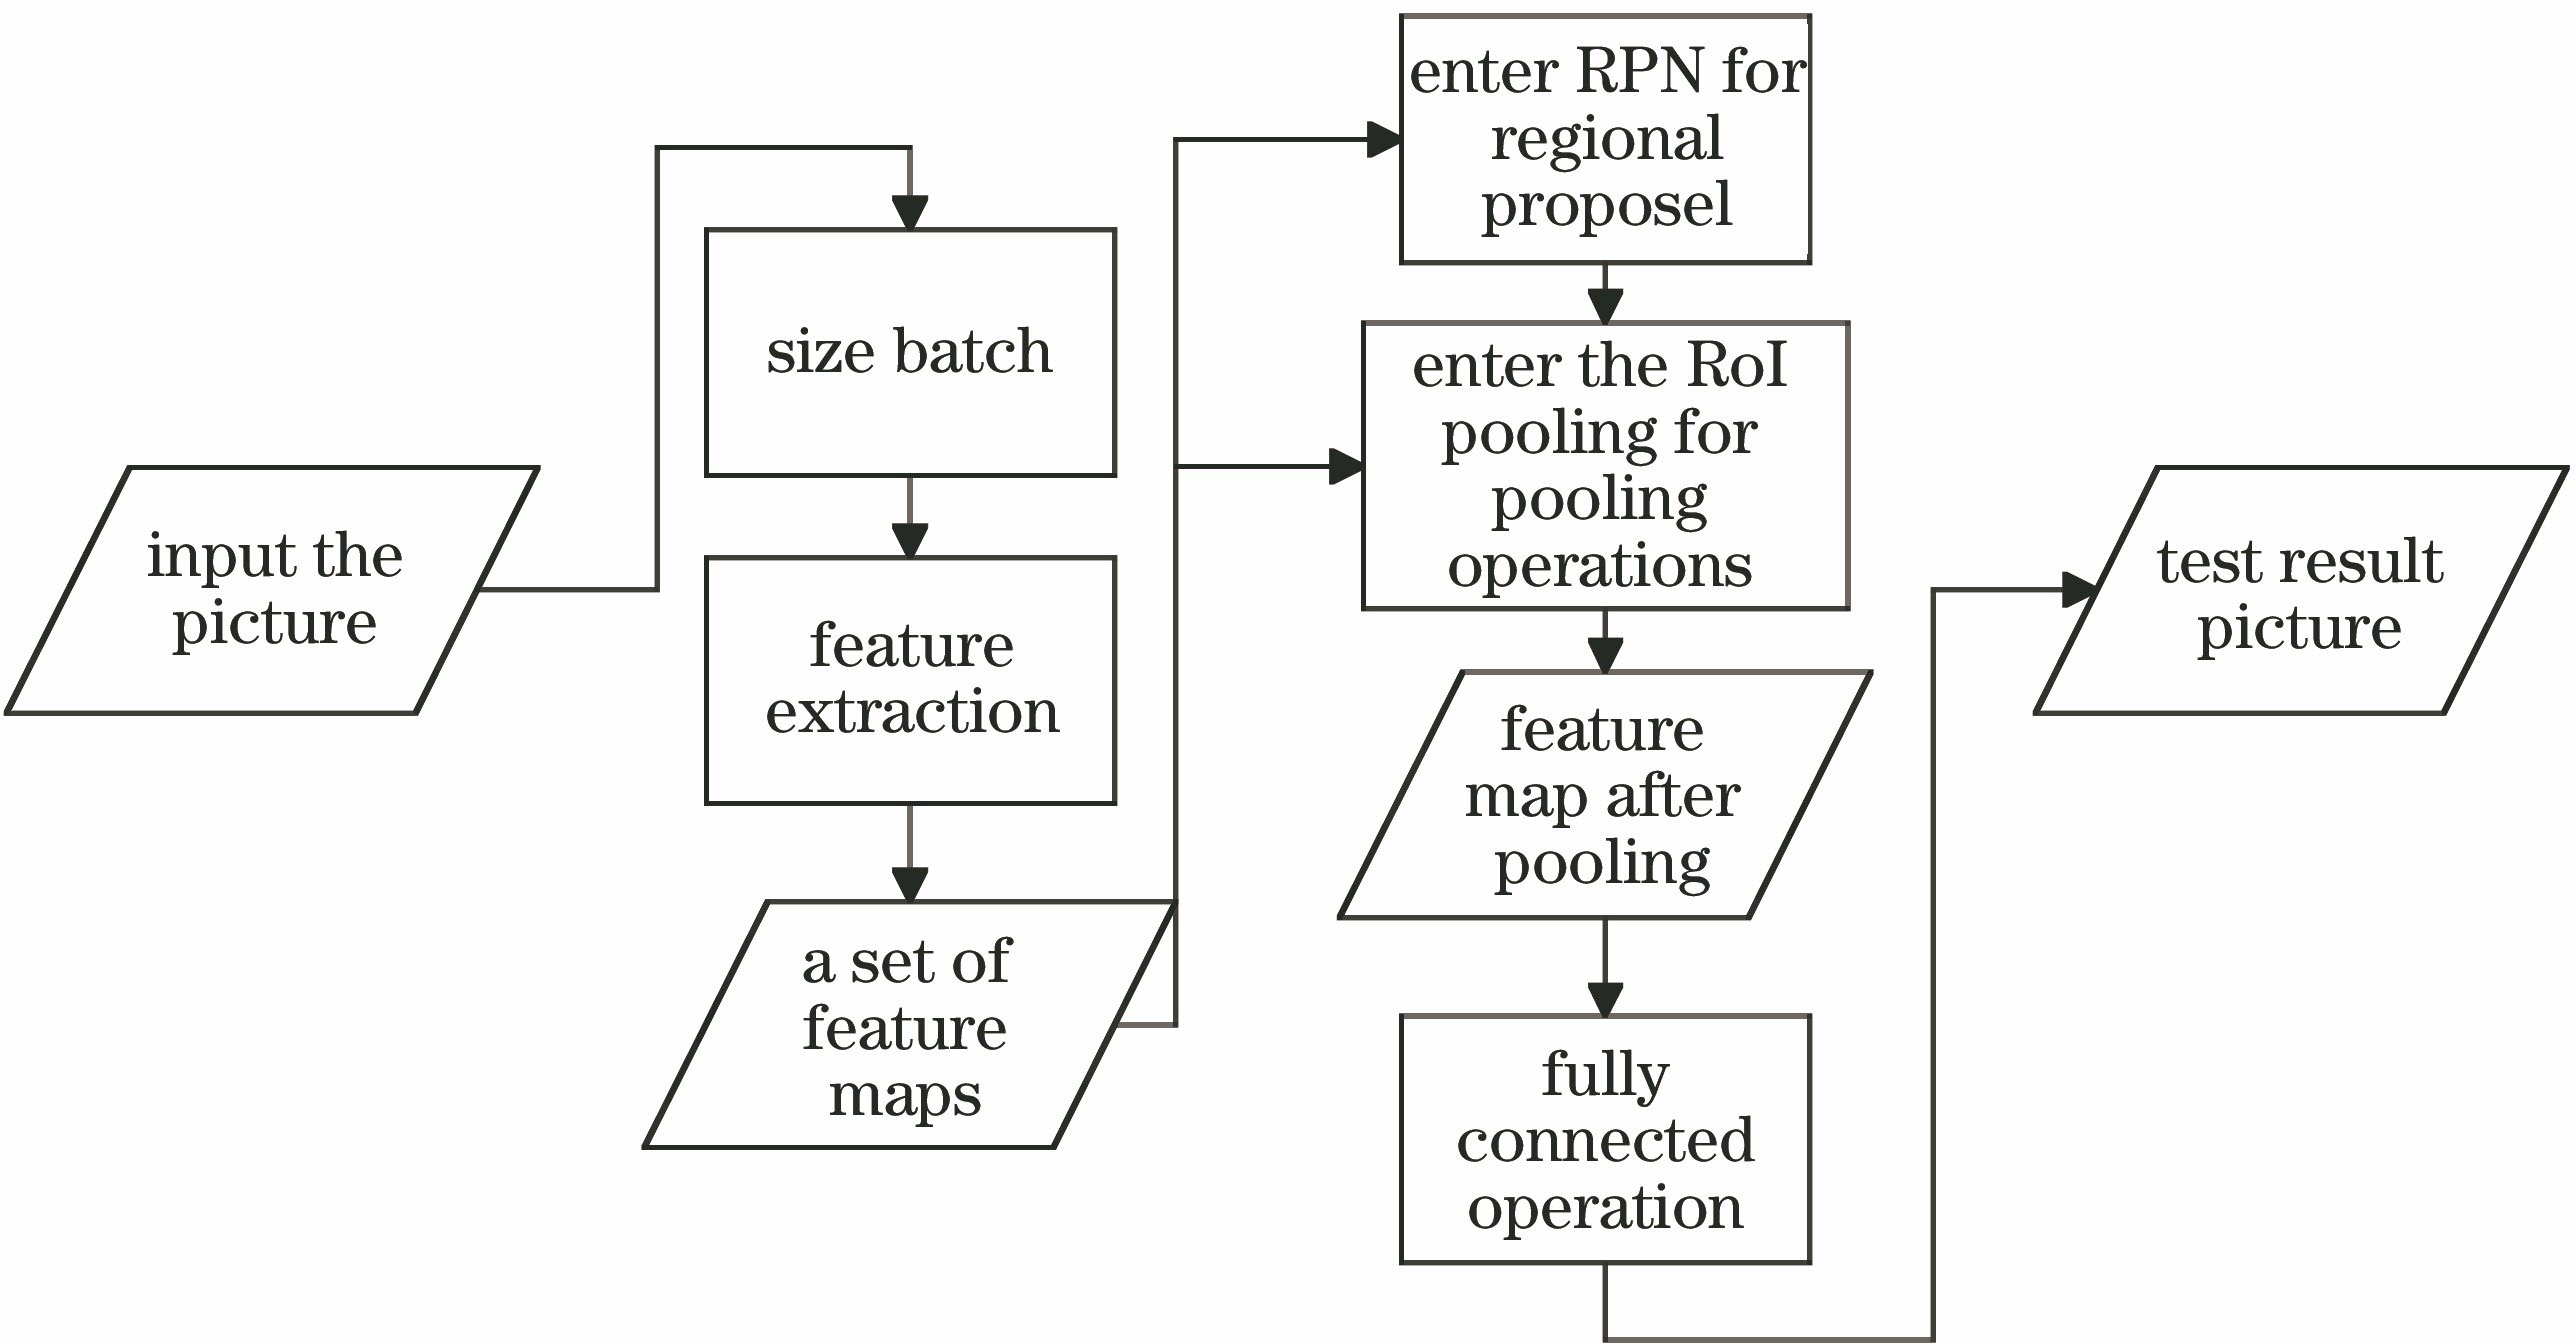
Fig. 1. Main process framework of detection
Fig. 2. Schematic of airport area detection
Fig. 3. Anchor generated based on the difference value algorithm and traditional anchors
Fig. 4. Comparison of the improved algorithm of adding T2 and the original algorithm P-R curve
Fig. 5. Schematic diagram of false detections and partial magnification
Fig. 6. Comparison of ROC curve between T3 improved algorithm and original algorithm
Fig. 7. Flow chart of data set construction
Fig. 8. Partial raw data set
| Difference value algorithm generates anchor box |
|---|
| Step 1: Extract the area and proportion information of the ground truth of some targets in each type of target from the regional proposal network as a sample.Step 2: The information extracted from various targets is transformed into a two-dimensional European space.Step 3: Initialize 9 anchor boxes randomly (the number selection is modeled after the Faster R-CNN detection algorithm. Too much is easy to multiply the calculation amount, and too few is not easy to represent the full scale of the target) and compare the 9 anchor boxes with all of the selected samples ground truth information and calculate the difference value of each box.Step 4: The ground truth with small difference value is divided into a combination around the corresponding anchor box.Step 5: Calculate the average size of the ground truth in each combination as a new anchor box.Step 6: Repeat the above steps until the difference does not change much after each iteration, and get the best 9 anchor boxes. |
|
Table 1. Schematic of difference value algorithm generates anchor step
| Method | mAP /% | Mean time /s |
|---|
| Faster R-CNN | 67.5 | 0.142 | | Faster R-CNN+T1 | 70.3 | 0.142 |
|
Table 2. Comparison of T1 improved algorithm and original algorithm performance
| Method | mAP /% | Mean time /s |
|---|
| Faster R-CNN | 67.5 | 0.142 | | Faster R-CNN+T2 | 68.8 | 0.143 |
|
Table 3. Comparison of improved algorithm and original algorithm performance of adding T2
| A priori decision implementation steps |
|---|
| Step 1: Read the classification results of the detection network from the log file (where the labels are assigned to the values 0, 1, 2, …, 6 in the order in Table 6) and the corresponding confidence levels.Step 2: If multiple types of labels are detected and the product of the label values is 0, then Step 3 is performed, otherwise the label name is directly output.Step 3: Compare the average of the detection confidence of the target with a non-zero label to the average of the target detection confidence with a label value of 0 to obtain a label with a larger average confidence value. If the target average confidence level with a label value of 0 is large, 0 is output, otherwise all other non-zero label values are output.Step 4: Read the label value in Step 3 and output the corresponding label name. |
|
Table 4. Prior judgment algorithm steps
| Item | Traditional remote sensing target detection data set | Experimental target detection data set |
|---|
| Category | Single class | Multi-class | | Scale | Medium/large | Small/medium/large scale(especially focusing on small scale targets) | | Perspective | Vertical viewing angle | 30°, 60°, 90°, etc. Multi-viewing angle | | Background | Simple background | Focus on target detection incomplex backgrounds(especially airport backgrounds) |
|
Table 5. Comparison of experimental data sets and traditional data sets
| Label | airport | airplane_mh | airplane_z | airplane_zs | airplane_y | bridge | oiltank |
|---|
| Object | Airport | Civil aircraft | Fighter | Helicopter | Transport | Bridge | Oil tank |
|
Table 6. Label and its corresponding target comparison table
| Algorithm steps |
|---|
| Step 1: Train the region proposal network separately, initialize the weights by the pre-trained model, and adjust the parameters in an end-to-end manner to give a proposal region.Step 2: Train the detection network separately. The region area for training comes from Step1. The weights are initialized using a pre-trained model.Step 3: Use the parameters of the Step2 detection model to initialize the regional proposal network while fixing the convolutional layer, and adjust only the regional proposal network parameters.Step 4: Use the proposal area output from Step3 as the input to the detection network, while keeping the shared convolutional layer fixed and fine-tune the remaining detection network parameters. |
|
Table 7. Algorithm steps
| Object | Airport | Civil aircraft | Helicopter | Fighter | Transport | Oil tank | Bridge |
|---|
| AP /% | 80.8415 | 84.8188 | 70.0974 | 62.1441 | 71.0077 | 73.5869 | 68.7273 |
|
Table 8. Summary of each target test results
Table 9. Airport test results
Table 10. Civil aviation aircraft test results
Table 11. Target test results under multiple categories
| Method | AP /% | Meantime /s |
|---|
| Airport | Civil aircraft | Helicopter | Fighter | Transport | Oil tank | Bridge |
|---|
| Faster R-CNN | 76.66 | 80.56 | 66.82 | 58.62 | 67.56 | 69.02 | 64.85 | 0.142 | | Proposed | 80.84 | 84.82 | 70.10 | 62.14 | 71.01 | 73.59 | 68.73 | 0.145 |
|
Table 12. Comparison of various target detection results between improved method and original algorithm
| Object | Method | AP /% | Mean time /s |
|---|
| Ref. [19] | 76.73 | 6.87 | | Civilaircraft | Faster R-CNN | 80.56 | 0.142 | | Proposed | 84.82 | 0.145 | | Ref. [7] | 72.78 | 20.86 | | Airport | Faster R-CNN | 76.66 | 0.142 | | Proposed | 80.84 | 0.145 |
|
Table 13. Comparison of results of different detection methods