
Xiaomei Jin, Wenyue Zhu, Qing Liu, Yehui Chen. Numerical Modeling and Simulation Analysis of Coherent Wind Lidar[J]. Acta Optica Sinica, 2021, 41(6): 0601003
- Acta Optica Sinica
- Vol. 41, Issue 6, 0601003 (2021)
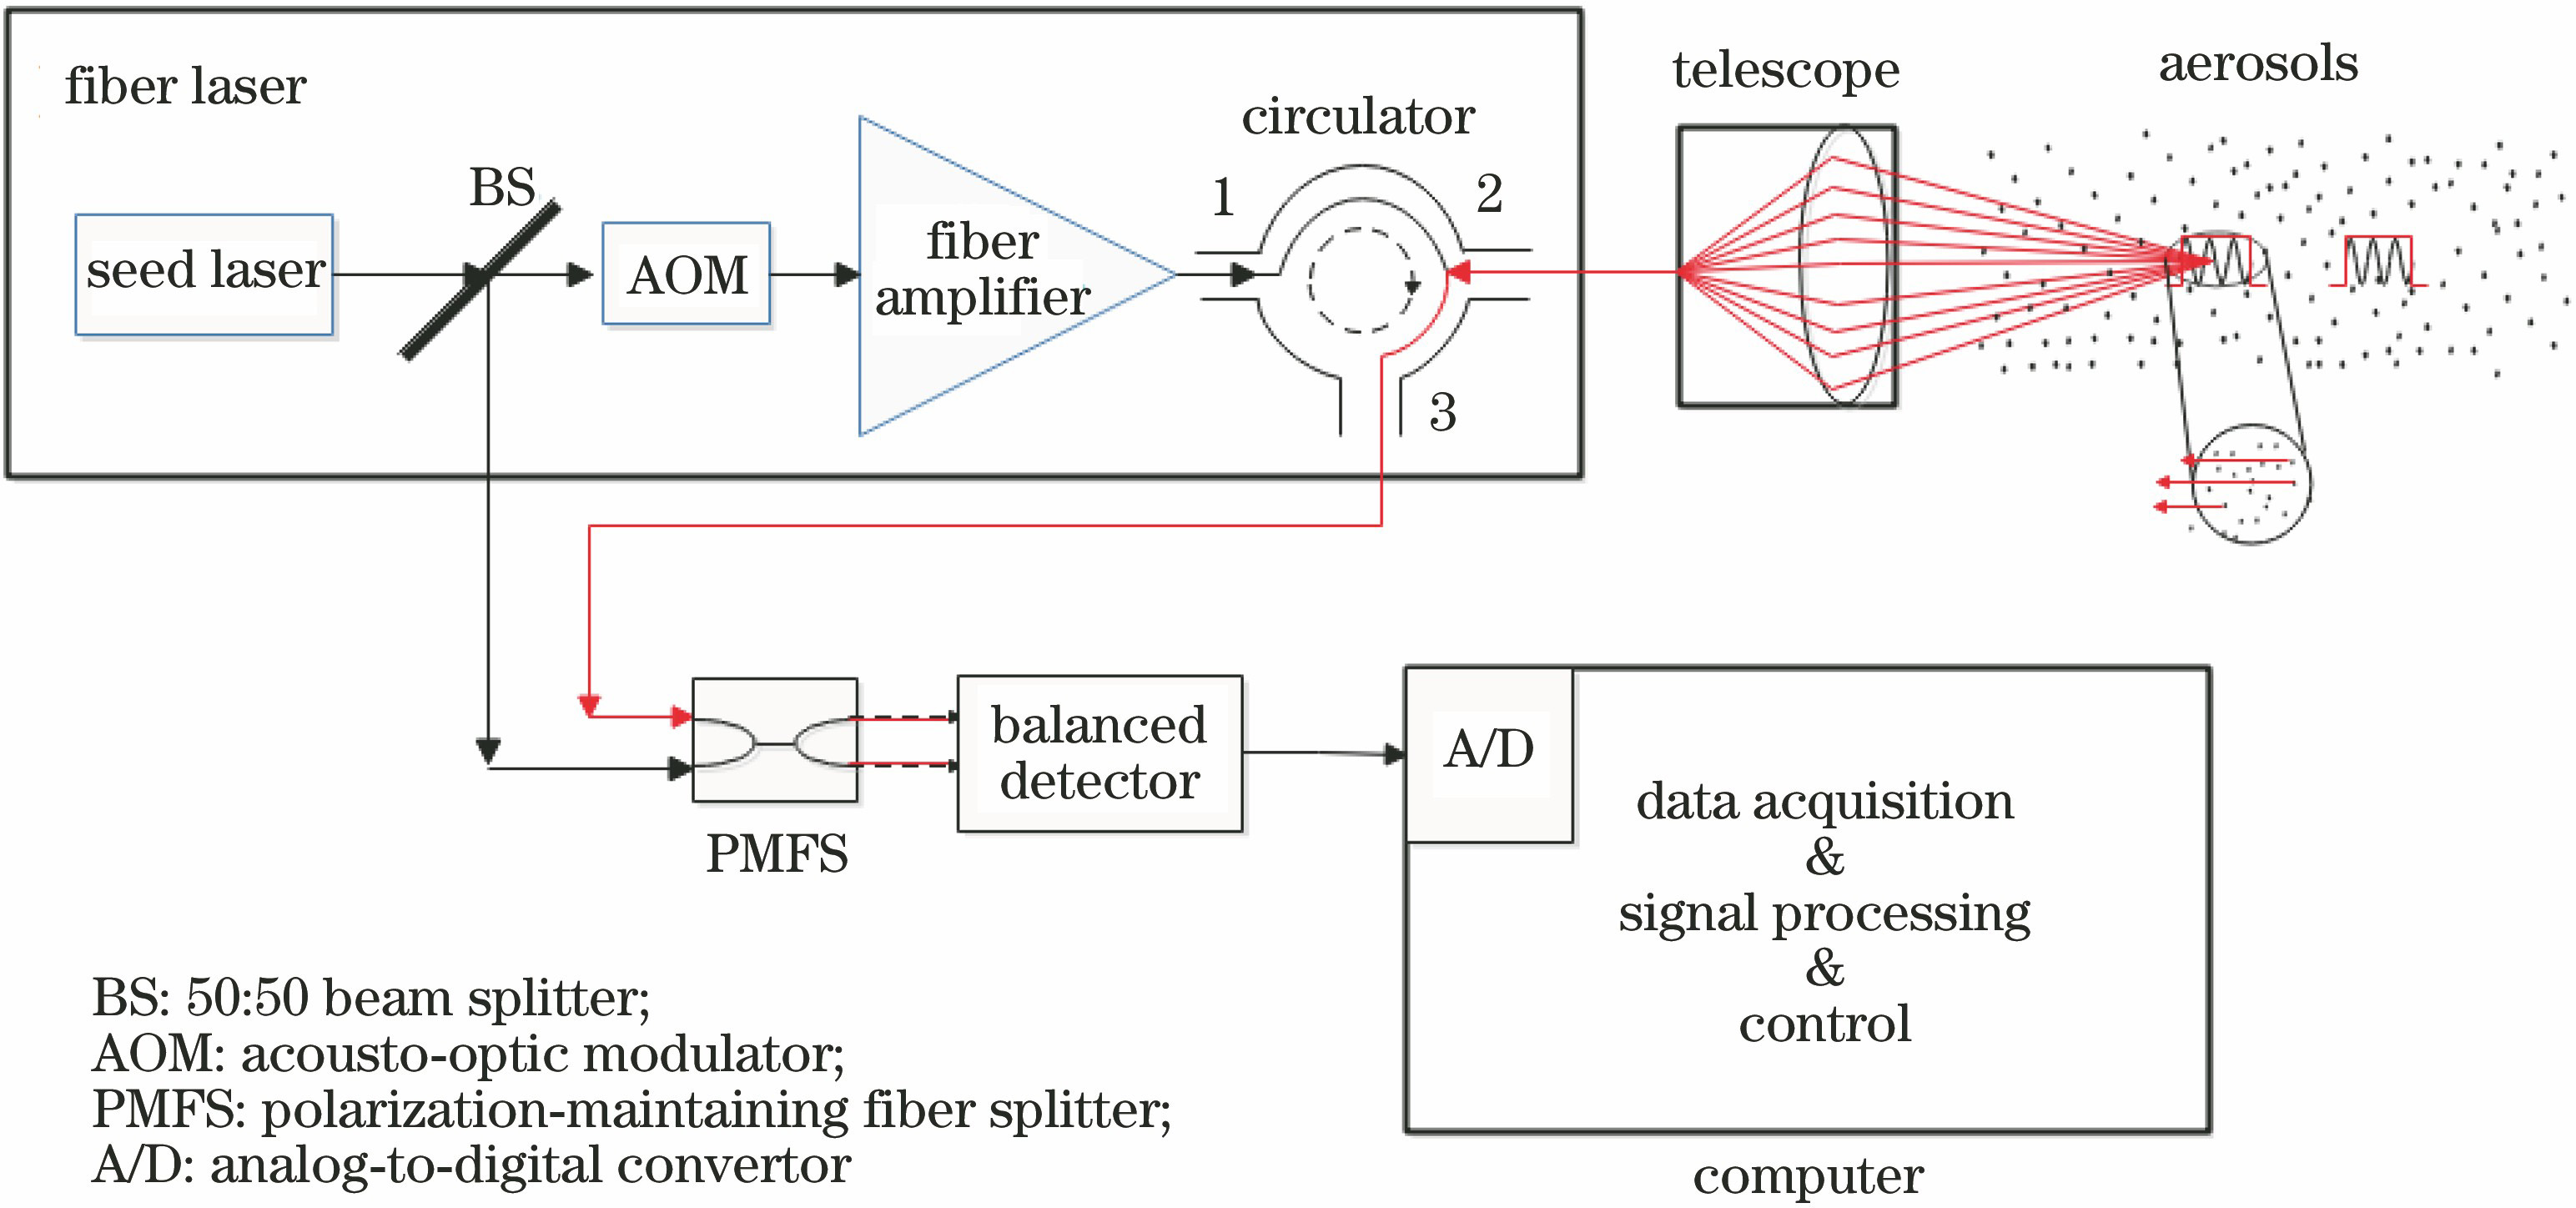
Fig. 1. Block diagram of coherent wind lidar system
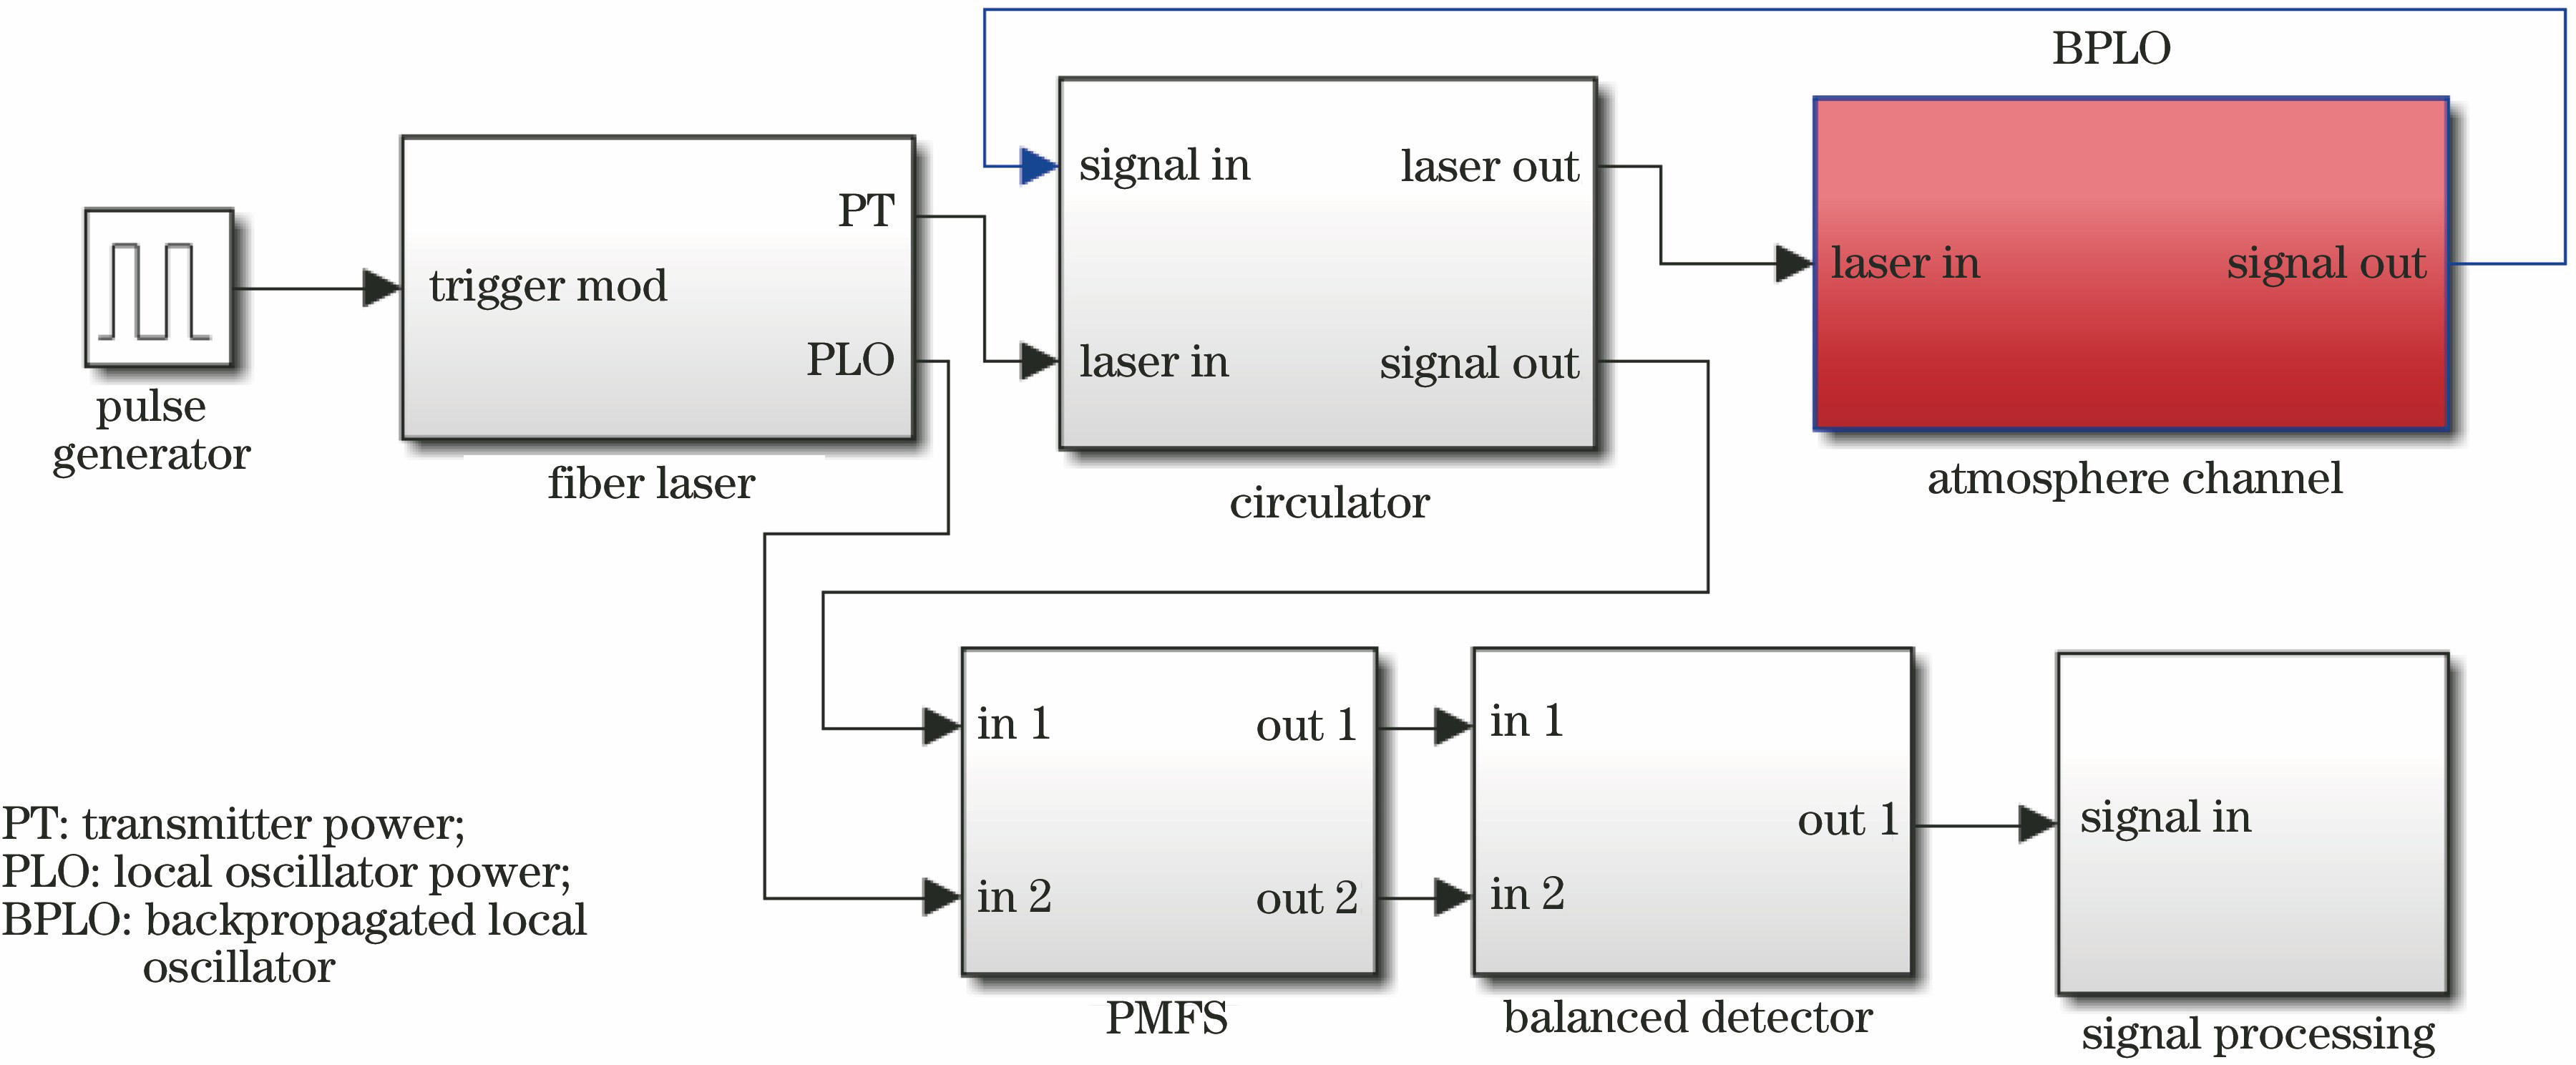
Fig. 2. Simulation block diagram of coherent wind lidar system
Fig. 3. Diagram of fiber laser model structure
Fig. 4. Simulation structure diagram of major devices. (a) AOM; (b) fiber amplifier
Fig. 5. Simulation structure diagram of atmospheric transmission module
Fig. 6. Simulation structure diagram of photoelectric conversion module
Fig. 7. Simulation structure diagram of data acquisition and processing module
Fig. 8. Simulated results of echo signal distribution under a single pulse. (a) HPE-LPRF; (b) LPE-HPRF
Fig. 9. Comparison between SNR of echo signal and theoretical SNR. (a) HPE-LPRF; (b) LPE-HPRF
Fig. 10. Normalized intensity distribution of echo signal
Fig. 11. Velocity inversion estimation in constant wind speed. (a) Single pulse; (b) multi-pulse accumulation average in 0.1 s
Fig. 12. Normalized power spectral distribution at 900 m. (a) Single pulse; (b) multi-pulse accumulation average in 0.1 s
Fig. 13. Velocity inversion estimation in NASA model. (a) Single pulse; (b) multi-pulse accumulation average in 0.1 s
| ||||||||||||||||||||||||||||||||||||||||||||||||
Table 1. Main technical parameters of system simulation
| ||||||||||||||||||||||||
Table 2. Results of simulation experiment in constant wind speed
| |||||||||||||||||||||||||||||
Table 3. Results of simulation experiment in NASA model

Set citation alerts for the article
Please enter your email address
© Copyright 2018-2021 | Chinese Laser Press. All Rights Reserved 沪ICP备15018463号-20