
Yu Zhang, Langlang Xiong, Meng Zhang, Xunya Jiang. Fractal topological band-gap structure induced by singularities in the one-dimensional Thue–Morse system[J]. Photonics Research, 2021, 9(4): 622
- Photonics Research
- Vol. 9, Issue 4, 622 (2021)
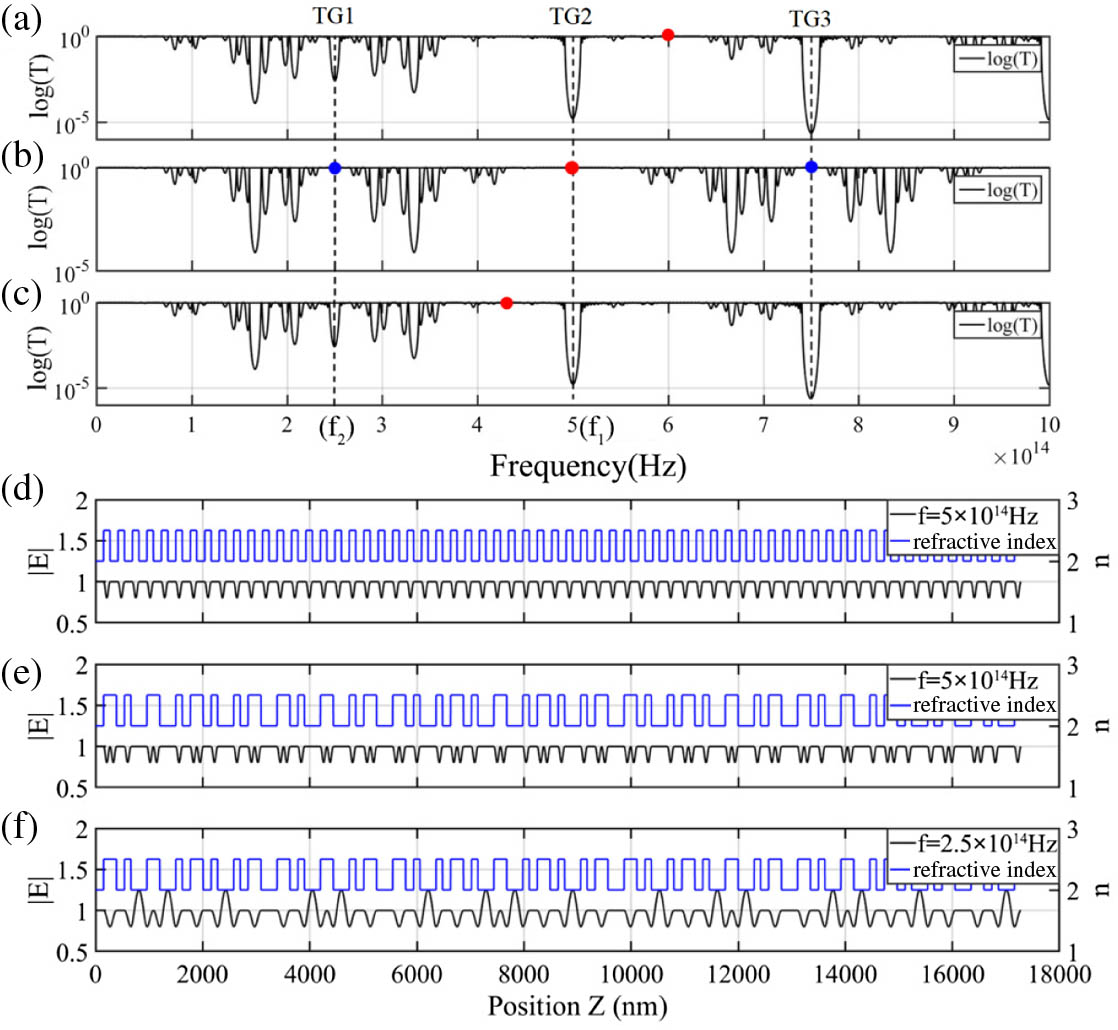
Fig. 1. (a)–(c) Transmission spectra of the S 7 σ = 5 12 , 1 2 , 7 12 | E ( z ) | f = 5 × 10 14 Hz | E ( z ) | f 1 = 5 × 10 14 Hz f 2 = 2.5 × 10 14 Hz
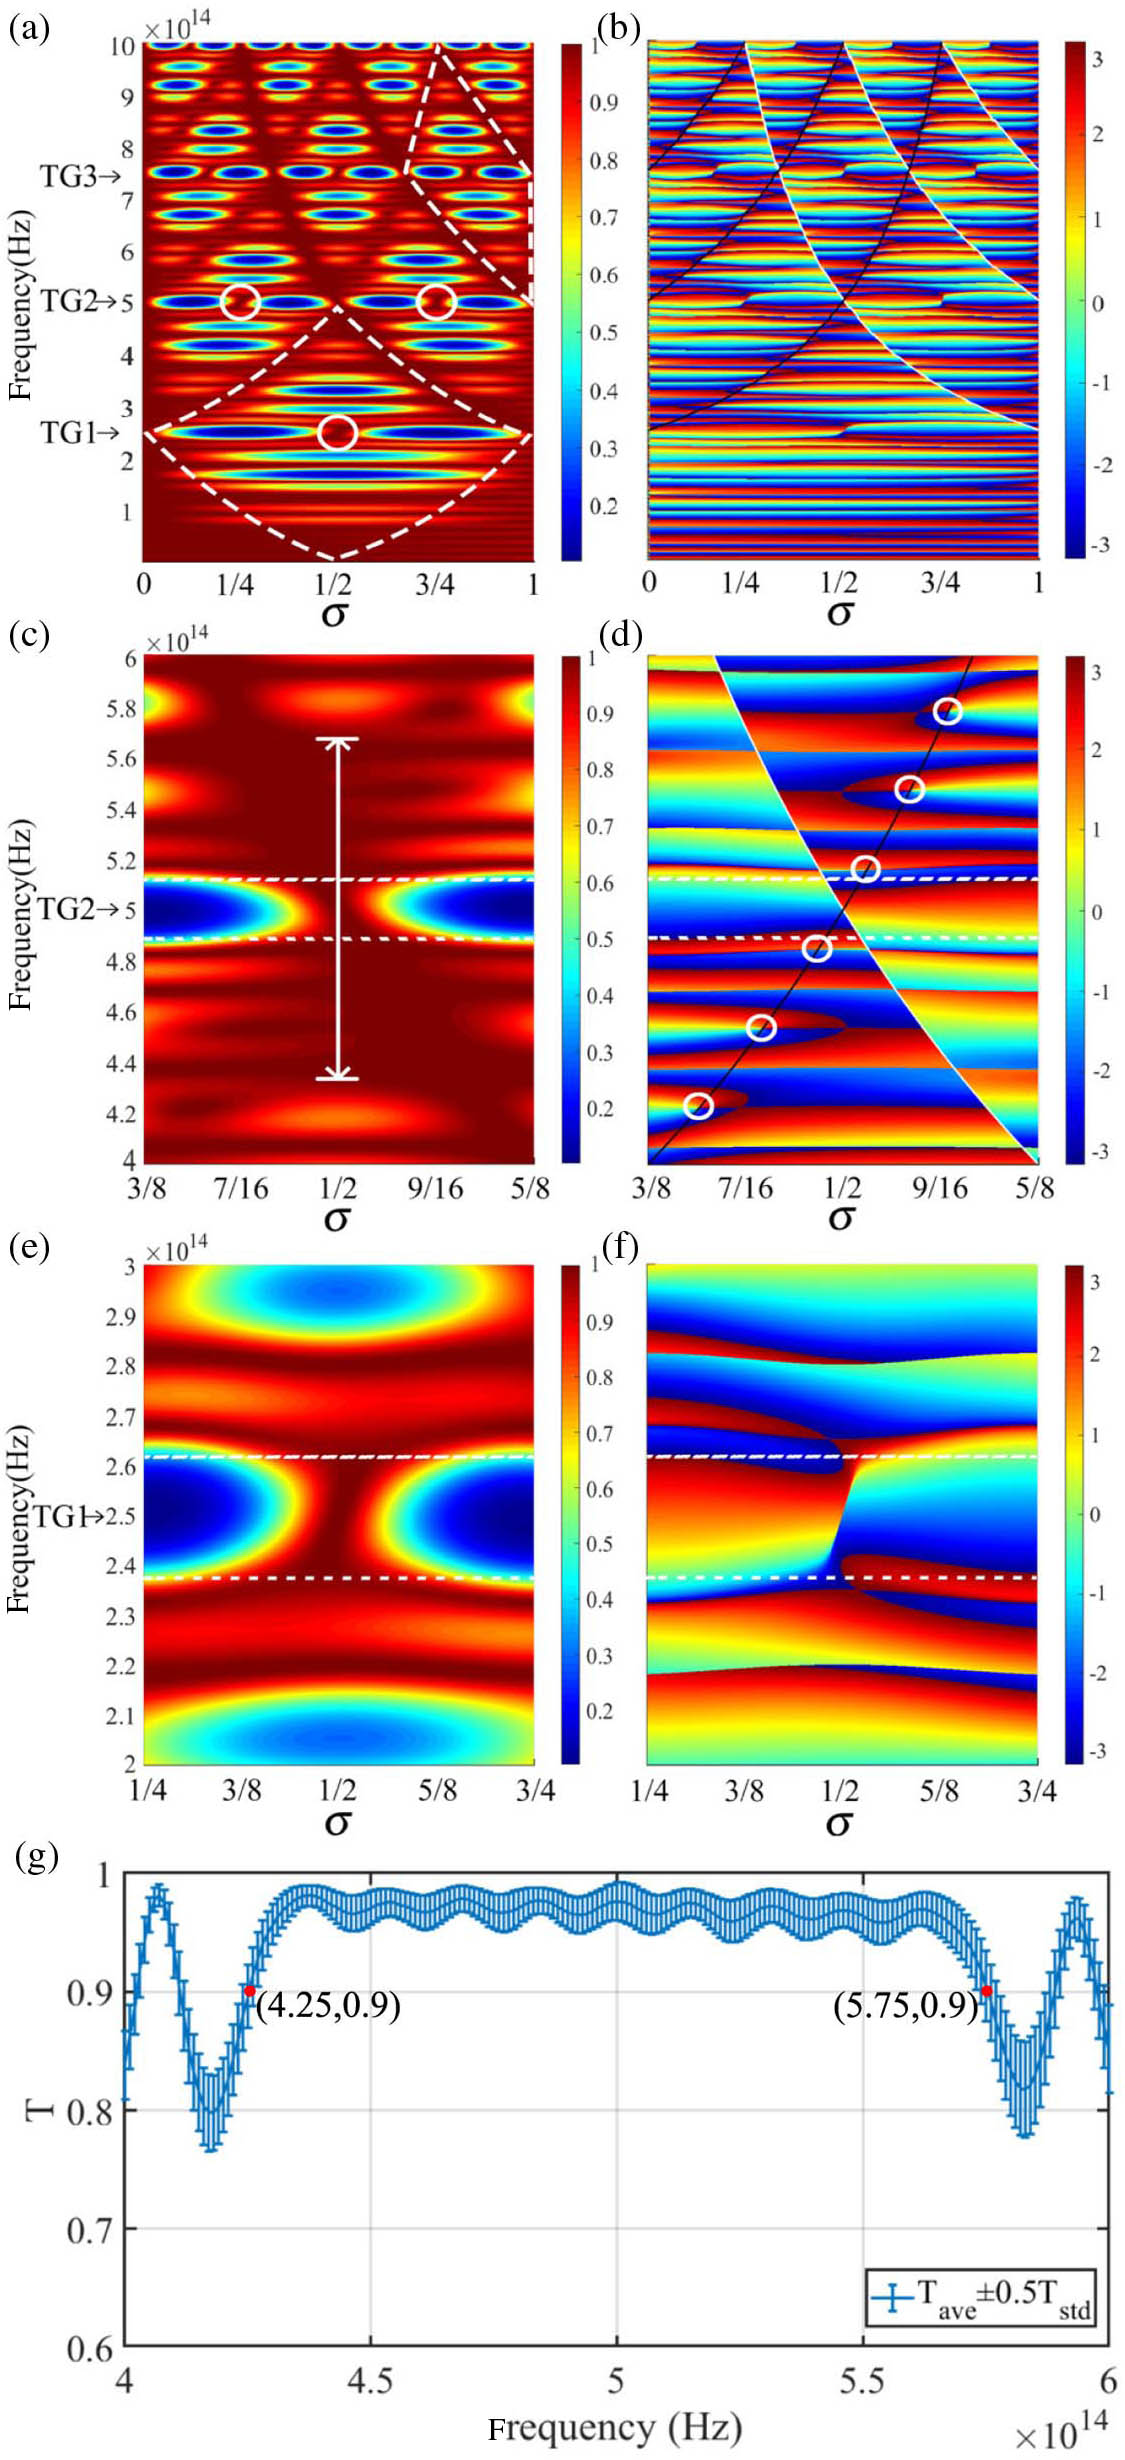
Fig. 2. (a) Transmission map of the S 5 σ f S 5 π S 5
Fig. 3. (a) Local transmission map near the second TG of the S 7 σ = 0.4 σ = 0.6 | E ( z ) | | E ( z ) | s L
Fig. 4. (a) Structure composed of two S 7 σ l = 3 5 σ r = 2 5 | E ( z ) | f = 2.5 × 10 14 Hz ϕ f ϕ f S 5 σ = 0.4
Fig. 5. (a) and (b) Maps of transmission and the reflection phase at the initial position of the S 8 S 8 σ l = 0.5458 σ r = 0.6333 | E ( z ) | f = 4.156907 × 10 14 Hz
Fig. 6. (a) and (b) Maps of transmission and the reflection phase at the initial position of the S 5 σ = 0.125, 0.4, 0.6, 0.875 | E ( z ) | L is the total length of the S 5

Set citation alerts for the article
Please enter your email address
© Copyright 2018-2021 | Chinese Laser Press. All Rights Reserved 沪ICP备15018463号-20