
Meng Zhang, Wei Wei, Yanna Zhang, Chunyan Zhao, Xin Li, Xiaobing Zheng. On-Orbit Automated Calibration of Hyperion Hyperspectral Remote Sensor[J]. Acta Optica Sinica, 2019, 39(5): 0528002
- Acta Optica Sinica
- Vol. 39, Issue 5, 0528002 (2019)
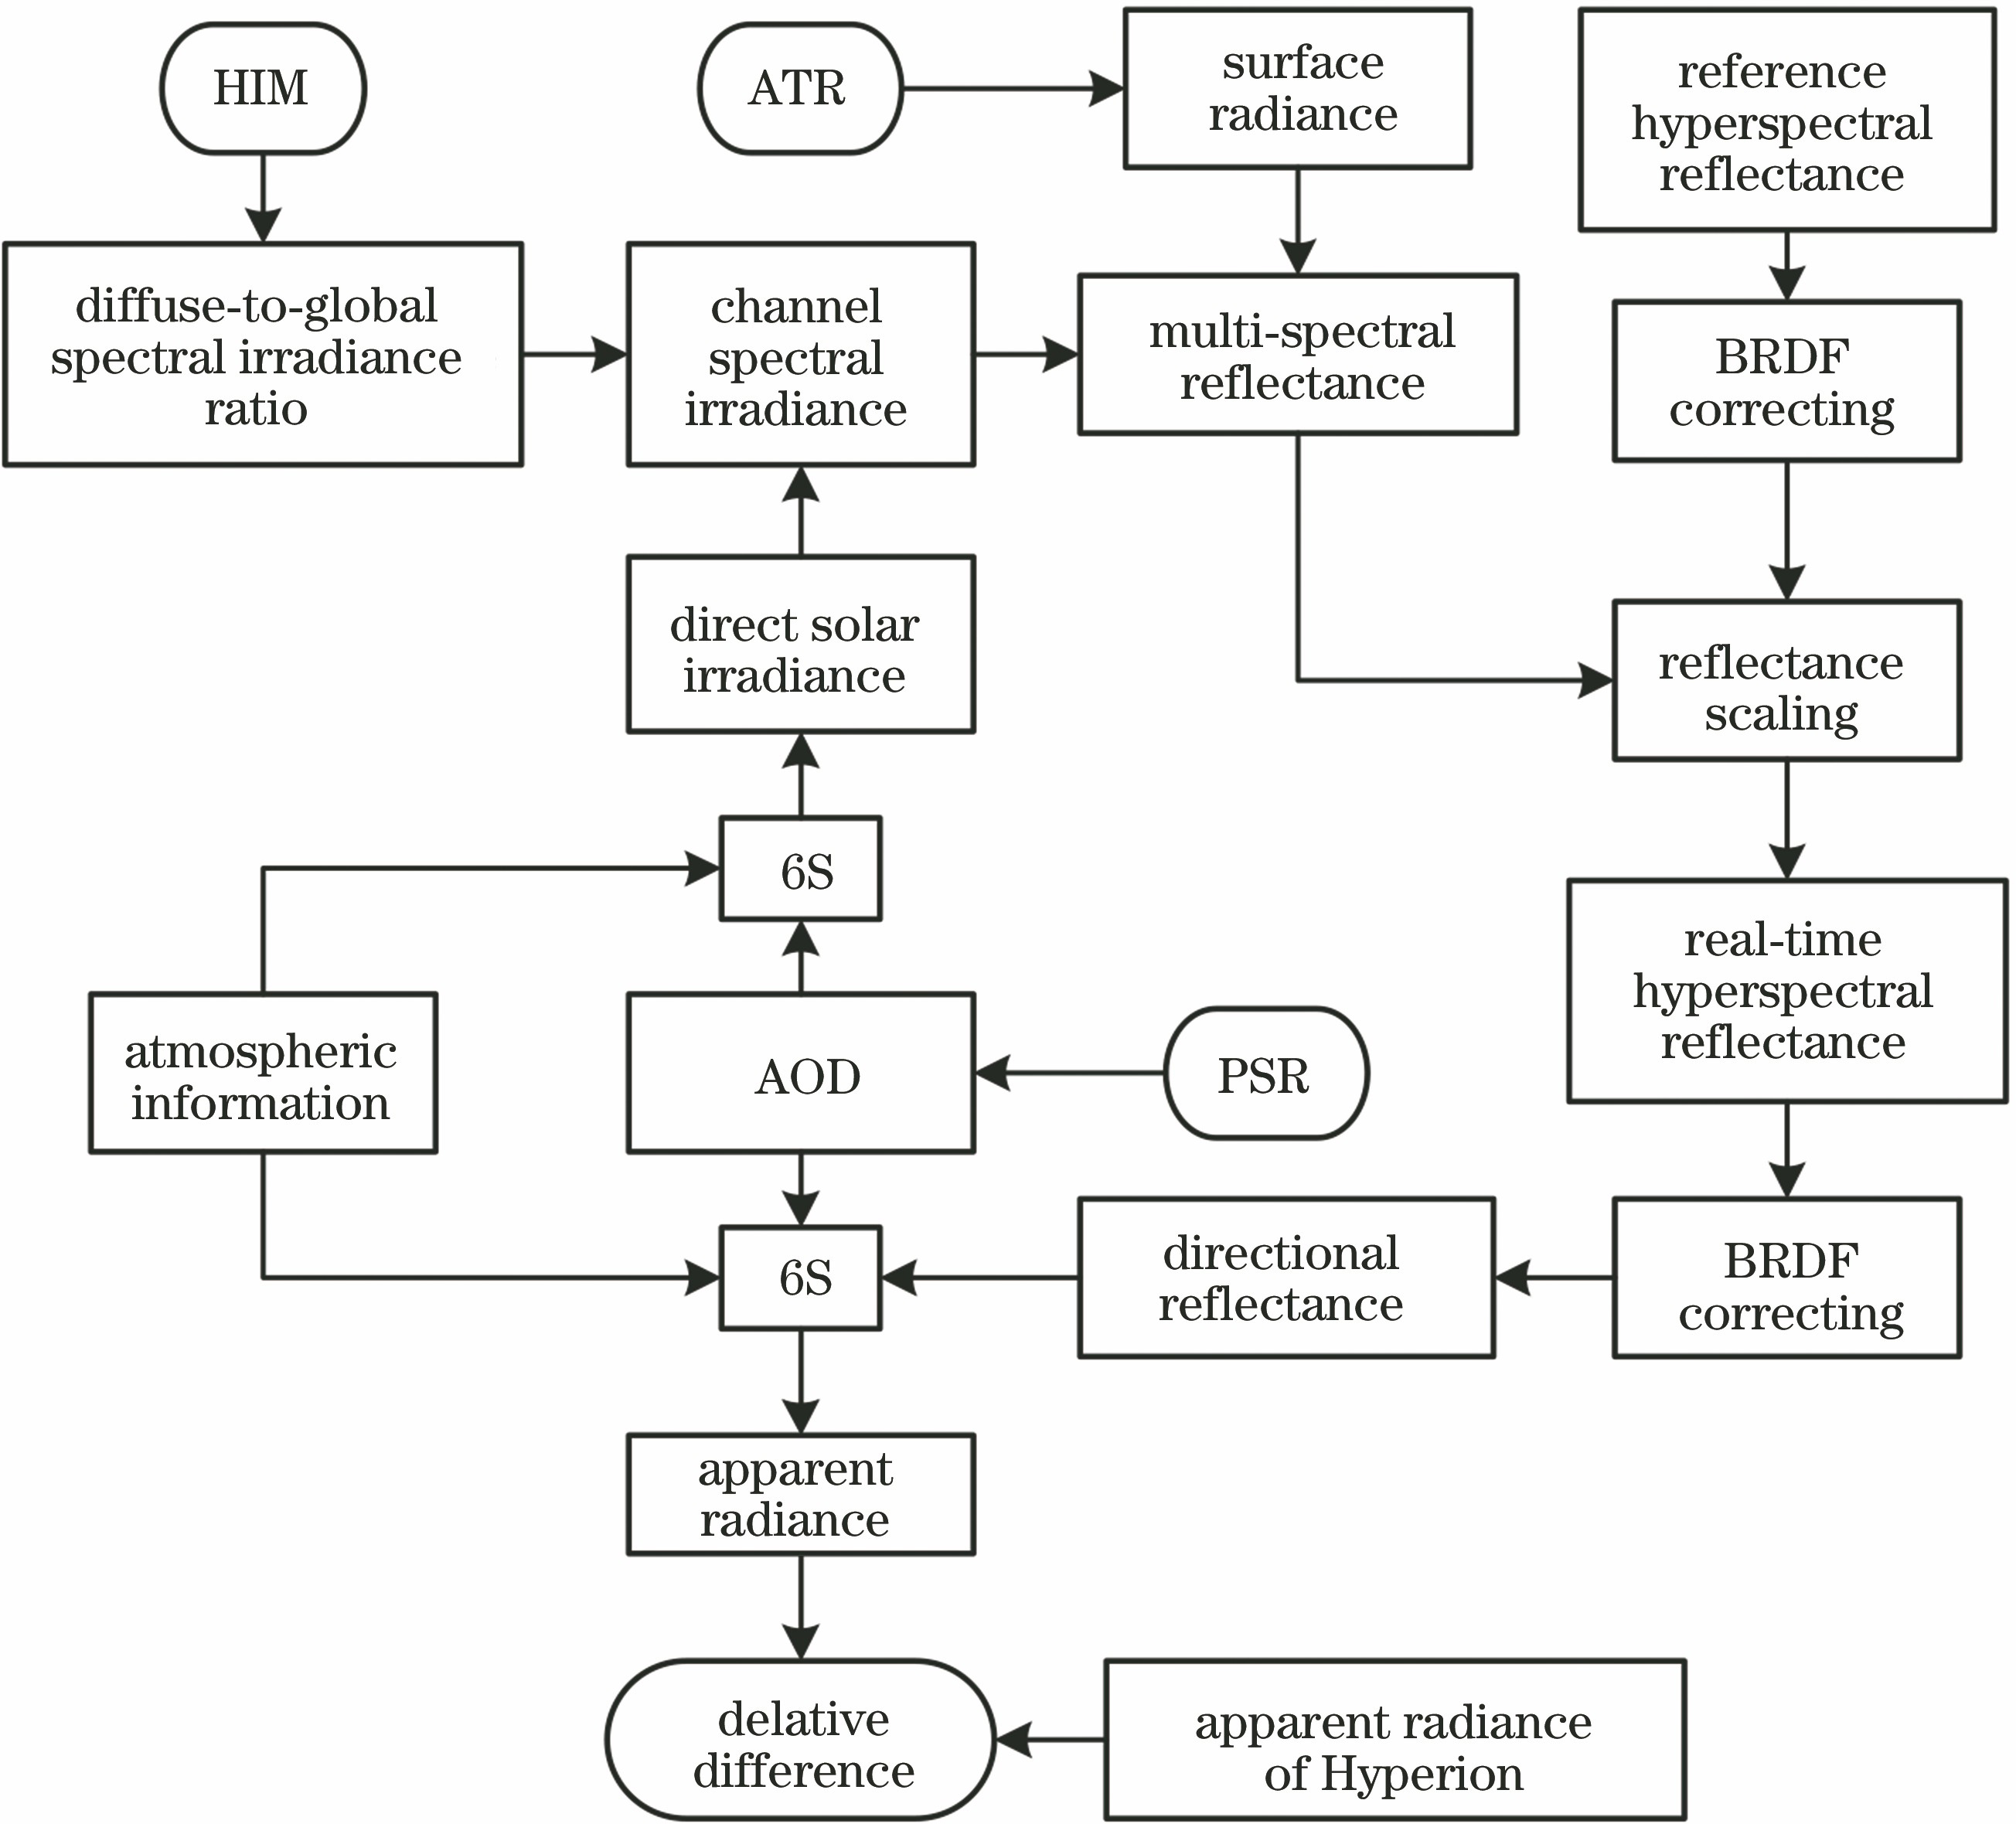
Fig. 1. Flow chart of site-automated observation calibration technology
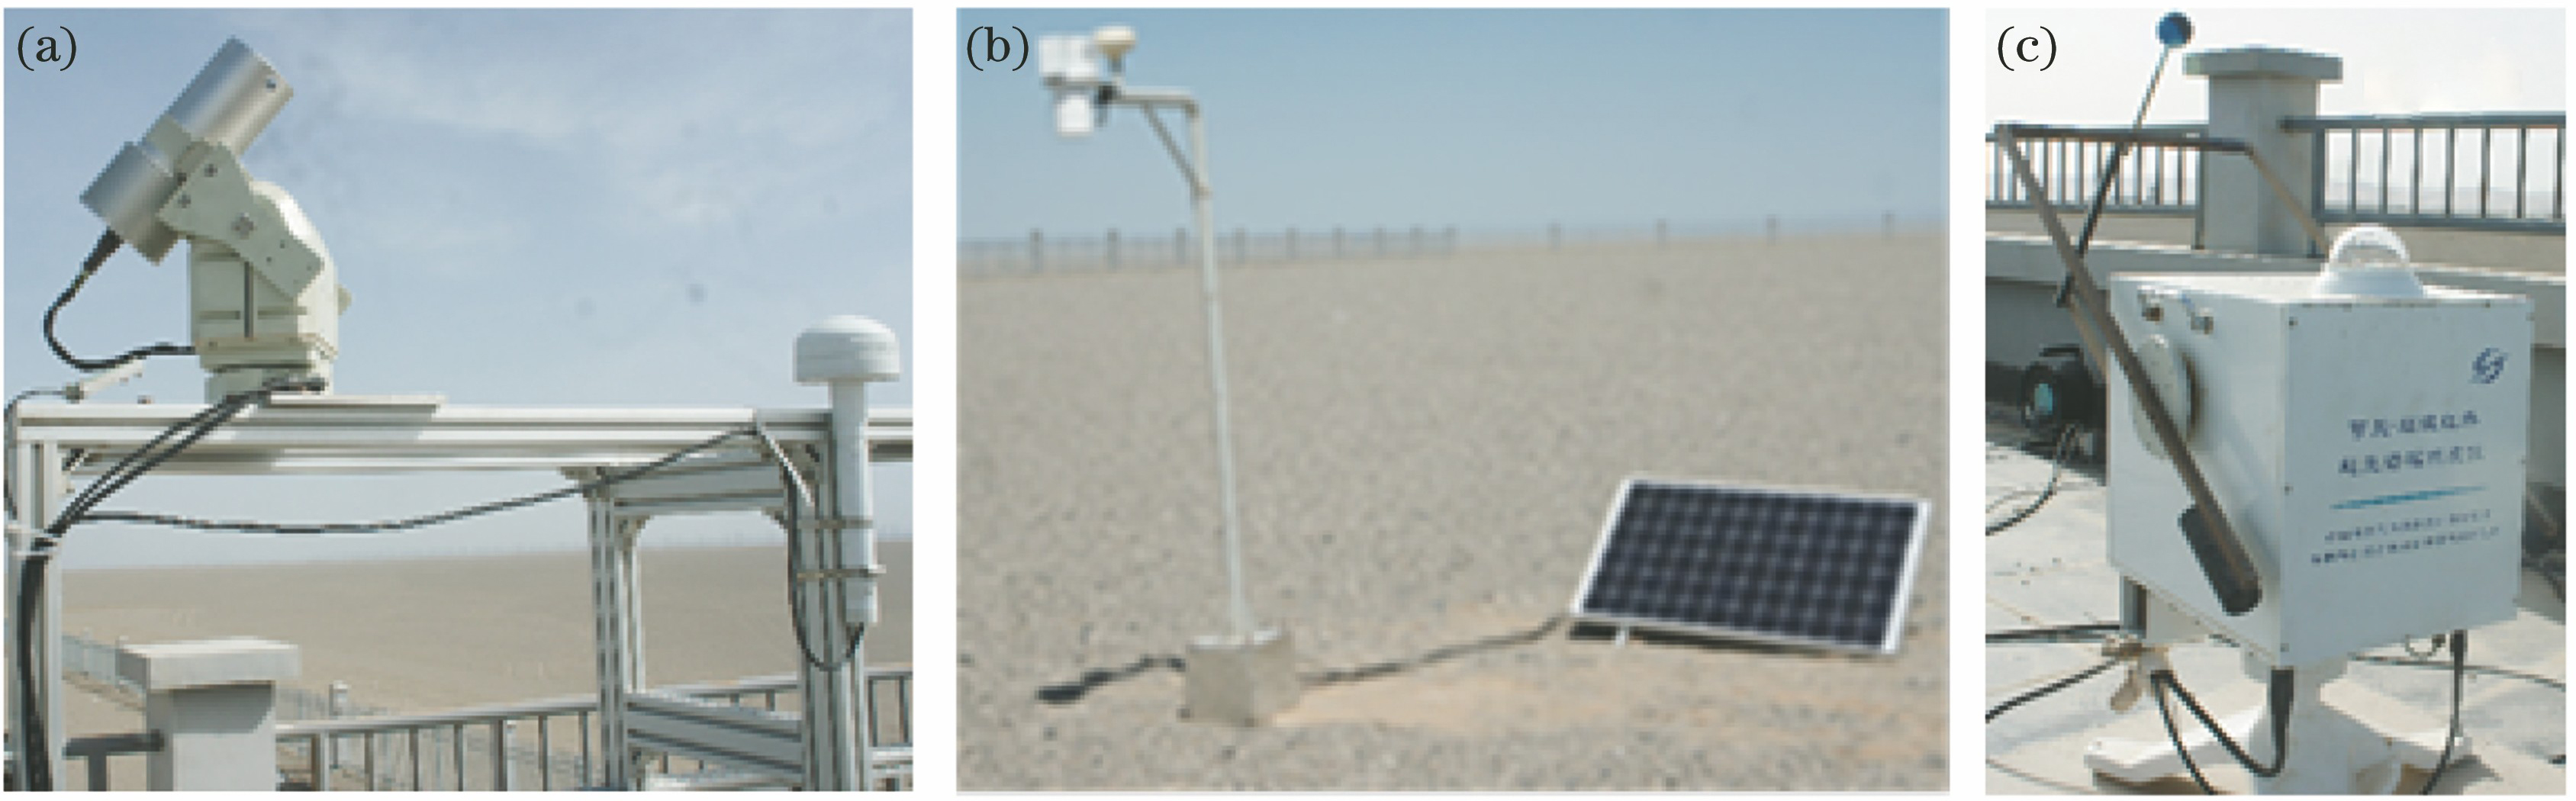
Fig. 2. Automated observation instruments. (a) PSR; (b) ATR; (c) HIM
Fig. 3. Aerosol optical depth for different dates. (a) October 14, 2016; (b) October 22, 2016; (c) November 2, 2016; (d) March 10, 2017
Fig. 4. Channel surface reflectance of ATR
Fig. 5. Reference reflectance for different dates
Fig. 6. Reflectance. (a) Hyperspectral reflectance; (b) channel reflectance
Fig. 7. Relative difference of channel reflectance
Fig. 8. Real-time hyperspectral reflectance
Fig. 9. TOA apparent radiance of 6S output
Fig. 10. TOA apparent radiance of satellite
Fig. 11. Relative difference of TOA apparent radiance
Fig. 12. Mean and standard deviation of relative difference of four automated calibrations
|
Table 1. Technical specifications of automated observation instruments
|
Table 2. Mean and standard deviation of relative difference
|
Table 3. Parameters when satellite overpassing

Set citation alerts for the article
Please enter your email address
© Copyright 2018-2021 | Chinese Laser Press. All Rights Reserved 沪ICP备15018463号-20