• Photonics Research
  • Vol. 6, Issue 11, 1062 (2018)
Mengya Liao1, Siming Chen1、*, Zhixin Liu1, Yi Wang2, Lalitha Ponnampalam1, Zichuan Zhou1, Jiang Wu1, Mingchu Tang1, Samuel Shutts3, Zizhuo Liu1, Peter M. Smowton3, Siyuan Yu2, Alwyn Seeds1, and Huiyun Liu1
Author Affiliations
  • 1Department of Electronic and Electrical Engineering, University College London, London WC1E 7JE, UK
  • 2State Key Laboratory of Optoelectronic Materials and Technologies, Sun Yat-sen University, Guangzhou 510275, China
  • 3Department of Physics and Astronomy, Cardiff University, Cardiff CF24 3AA, UK
  • show less
    DOI: 10.1364/PRJ.6.001062 Cite this Article Set citation alerts
    Mengya Liao, Siming Chen, Zhixin Liu, Yi Wang, Lalitha Ponnampalam, Zichuan Zhou, Jiang Wu, Mingchu Tang, Samuel Shutts, Zizhuo Liu, Peter M. Smowton, Siyuan Yu, Alwyn Seeds, Huiyun Liu. Low-noise 1.3  μm InAs/GaAs quantum dot laser monolithically grown on silicon[J]. Photonics Research, 2018, 6(11): 1062 Copy Citation Text show less
    (a) Bright-field scanning TEM image of the QD active layers. (b) PL comparison of InAs/GaAs QDs SLD structure grown on Si to a reference sample grown on native GaAs under the same pump conditions. The inset shows the representative AFM image of an uncapped QD sample grown on Si. (c) Optical micrography of rows of the fabricated narrow-ridge-waveguide laser. (d) Cross-sectional SEM image of the fabricated laser with as-cleaved facets.
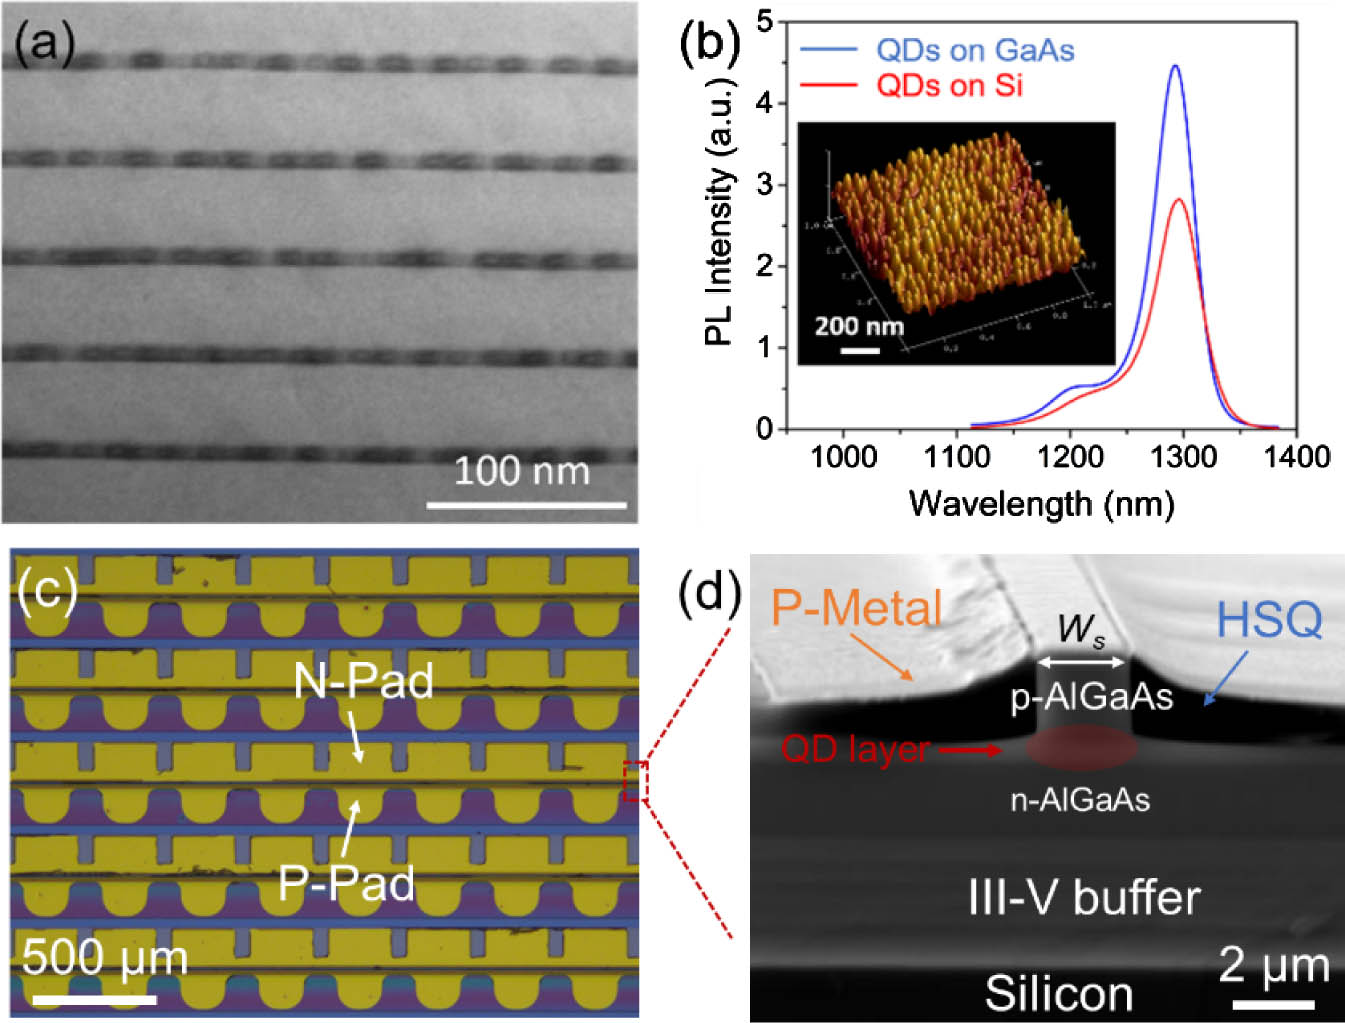
    Fig. 1. (a) Bright-field scanning TEM image of the QD active layers. (b) PL comparison of InAs/GaAs QDs SLD structure grown on Si to a reference sample grown on native GaAs under the same pump conditions. The inset shows the representative AFM image of an uncapped QD sample grown on Si. (c) Optical micrography of rows of the fabricated narrow-ridge-waveguide laser. (d) Cross-sectional SEM image of the fabricated laser with as-cleaved facets.
    Experimental setup of RIN measurement. ISO, optical isolator.
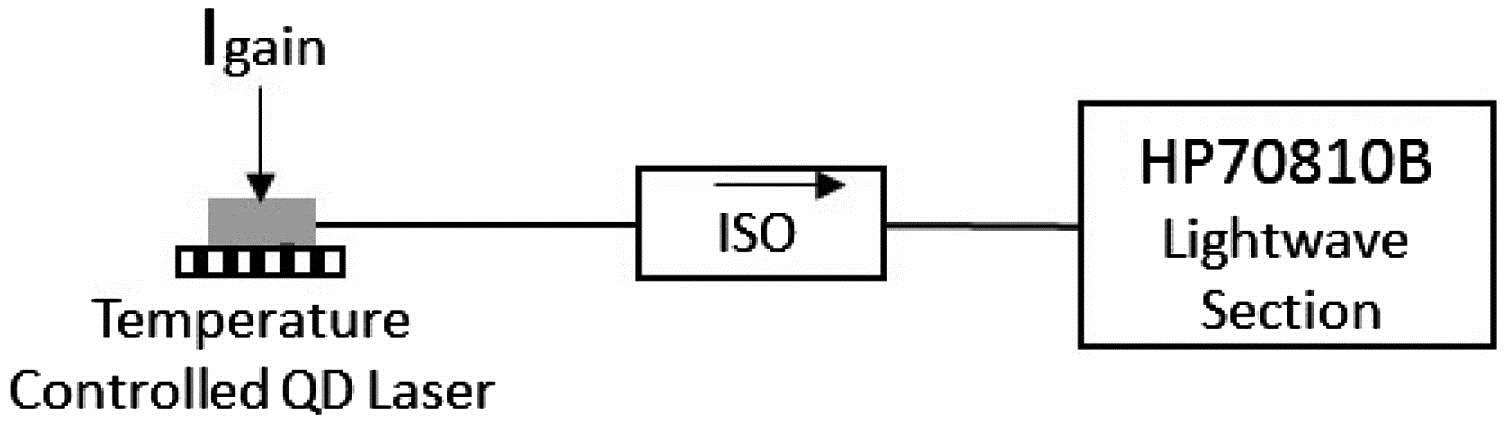
    Fig. 2. Experimental setup of RIN measurement. ISO, optical isolator.
    Experimental system for data transmission. PC, polarization controller; Amp., radio frequency amplifier; PPG, pseudorandom pattern generator; SMF-28, standard single-mode fiber.
    Fig. 3. Experimental system for data transmission. PC, polarization controller; Amp., radio frequency amplifier; PPG, pseudorandom pattern generator; SMF-28, standard single-mode fiber.
    (a) RT CW LIV curves for total power and single-mode coupled power from a 2.2 μm×2.5 mm narrow-ridge-waveguide laser. (b) Lateral near-field intensity profiles with different injection currents. Inset: infrared (IR) camera image of lasing near-field at the threshold of 20 mA (well above threshold). (c) High-resolution CW lasing spectrum from a 2.2 μm×2.5 mm narrow-ridge-waveguide laser at an injection current of 40 mA. (d) Measured CW L-I curve from a 2.2 μm×4 mm narrow-ridge-waveguide laser as a function of temperature.
    Fig. 4. (a) RT CW LIV curves for total power and single-mode coupled power from a 2.2  μm×2.5  mm narrow-ridge-waveguide laser. (b) Lateral near-field intensity profiles with different injection currents. Inset: infrared (IR) camera image of lasing near-field at the threshold of 20 mA (well above threshold). (c) High-resolution CW lasing spectrum from a 2.2  μm×2.5  mm narrow-ridge-waveguide laser at an injection current of 40 mA. (d) Measured CW L-I curve from a 2.2  μm×4  mm narrow-ridge-waveguide laser as a function of temperature.
    (a) RIN spectra up to 16 GHz at gain currents of 40, 60, and 80 mA. (b) Measured RIN in the 6–10 GHz region with bias. (c) Relaxation oscillation frequency with bias.
    Fig. 5. (a) RIN spectra up to 16 GHz at gain currents of 40, 60, and 80 mA. (b) Measured RIN in the 6–10 GHz region with bias. (c) Relaxation oscillation frequency with bias.
    (a) Experimental results. 25.6 Gb/s eye diagrams (a) at back-to-back (received power of −7 dBm) and (b) after transmission over 13 km SMF-28. (c) BER at different received power at back-to-back (square marker) and after transmission (circle marker) using threshold detection.
    Fig. 6. (a) Experimental results. 25.6 Gb/s eye diagrams (a) at back-to-back (received power of 7  dBm) and (b) after transmission over 13 km SMF-28. (c) BER at different received power at back-to-back (square marker) and after transmission (circle marker) using threshold detection.
    Mengya Liao, Siming Chen, Zhixin Liu, Yi Wang, Lalitha Ponnampalam, Zichuan Zhou, Jiang Wu, Mingchu Tang, Samuel Shutts, Zizhuo Liu, Peter M. Smowton, Siyuan Yu, Alwyn Seeds, Huiyun Liu. Low-noise 1.3  μm InAs/GaAs quantum dot laser monolithically grown on silicon[J]. Photonics Research, 2018, 6(11): 1062
    Download Citation