• Matter and Radiation at Extremes
  • Vol. 5, Issue 6, 064402 (2020)
Y. X. Geng1、*, D. Wu2, W. Yu3, Z. M. Sheng4、5, S. Fritzsche6, Q. Liao1, M. J. Wu1, X. H. Xu1, D. Y. Li1, W. J. Ma1, H. Y. Lu1, Y. Y. Zhao1, X. T. He1, J. E. Chen1, C. Lin1, and X. Q. Yan1
Author Affiliations
  • 1Key Laboratory of HEDP of the Ministry of Education, CAPT, and State Key Laboratory of Nuclear Physics and Technology, Peking University, Beijing 100871, China
  • 2Institute for Fusion Theory and Simulation, Department of Physics, Zhejiang University, 310058 Hangzhou, China
  • 3State Key Laboratory of High Field Laser Physics, Shanghai Institute of Optics and Fine Mechanics, 201800 Shanghai, China
  • 4SUPA Department of Physics, University of Strathclyde, Glasgow G4 0NG, United Kingdom
  • 5Key Laboratory for Laser Plasmas (Ministry of Education), School of Physics and Astronomy, Shanghai Jiao Tong University, Shanghai 200240, China
  • 6Helmholtz Institut-Jena and Friedrich-Schiller-University, D-07743 Jena, Germany
  • show less
    DOI: 10.1063/5.0014854 Cite this Article
    Y. X. Geng, D. Wu, W. Yu, Z. M. Sheng, S. Fritzsche, Q. Liao, M. J. Wu, X. H. Xu, D. Y. Li, W. J. Ma, H. Y. Lu, Y. Y. Zhao, X. T. He, J. E. Chen, C. Lin, X. Q. Yan. Proton beams from intense laser-solid interaction: Effects of the target materials[J]. Matter and Radiation at Extremes, 2020, 5(6): 064402 Copy Citation Text show less
    (a) Experimental setup. (b) Variation of the proton cutoff energy with target thickness. The diamond symbols represent the averages of the five best shots in the experiments, and the triangles represent the results of the PIC simulations. (c) Optimum energy spectra of protons from aluminum and plastic targets detected by the Thomson spectrometer. Solid lines represent experimental results and dashed lines PIC simulations. (d), (f), (g) and (e), (h), (i) Energy-resolved spatial distributions of proton beams detected by the RCF stack for the 2.5 µm aluminum and 1.2 µm plastic targets, respectively. The white dashed circles indicate the positions of protons with a deflection angle of 14°.
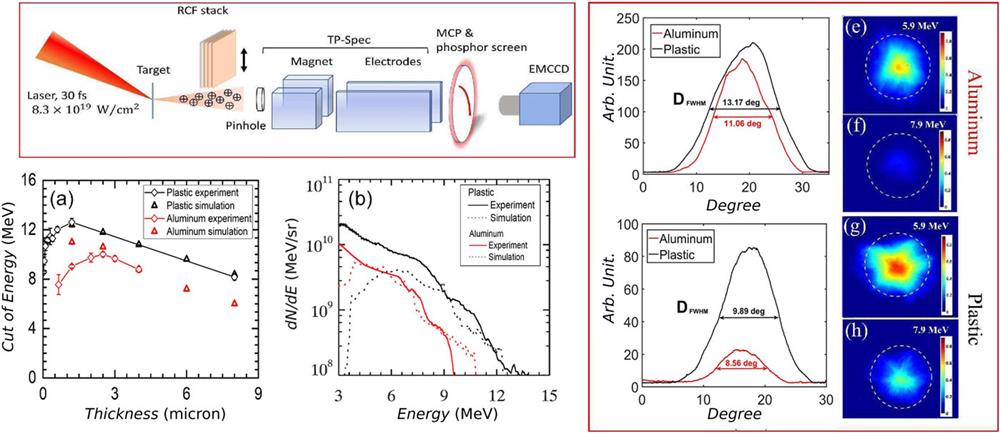
    Fig. 1. (a) Experimental setup. (b) Variation of the proton cutoff energy with target thickness. The diamond symbols represent the averages of the five best shots in the experiments, and the triangles represent the results of the PIC simulations. (c) Optimum energy spectra of protons from aluminum and plastic targets detected by the Thomson spectrometer. Solid lines represent experimental results and dashed lines PIC simulations. (d), (f), (g) and (e), (h), (i) Energy-resolved spatial distributions of proton beams detected by the RCF stack for the 2.5 µm aluminum and 1.2 µm plastic targets, respectively. The white dashed circles indicate the positions of protons with a deflection angle of 14°.
    Energy (transfer) as a function of time. Data are shown for laser energy entering the simulation box (black), electromagnetic energy (red), electron kinetic energy (green), and ion kinetic energy (blue). The results from plastic targets (dashed lines) are compared with those from aluminum targets (solid lines). Here, the thickness is 1.2 µm for both aluminum and plastic targets.
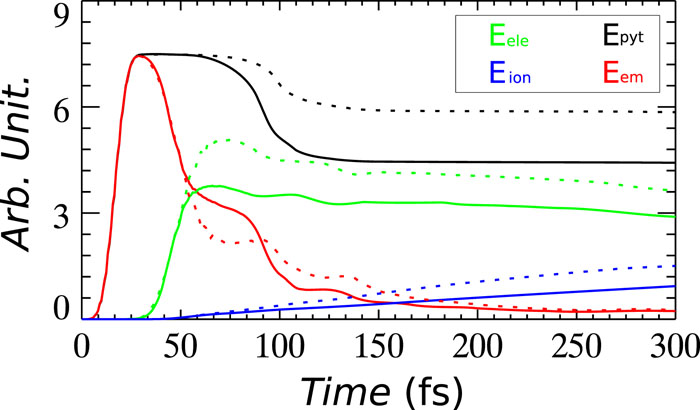
    Fig. 2. Energy (transfer) as a function of time. Data are shown for laser energy entering the simulation box (black), electromagnetic energy (red), electron kinetic energy (green), and ion kinetic energy (blue). The results from plastic targets (dashed lines) are compared with those from aluminum targets (solid lines). Here, the thickness is 1.2 µm for both aluminum and plastic targets.
    Electromagnetic energy densities for (a) aluminum and (b) plastic targets at t = 53 fs (i.e., 20T0). The solid lines indicate the initial positions of the solid targets, and the dashed lines mark the fronts of the pre-plasma. The thickness is 1.2 µm for both targets.
    Fig. 3. Electromagnetic energy densities for (a) aluminum and (b) plastic targets at t = 53 fs (i.e., 20T0). The solid lines indicate the initial positions of the solid targets, and the dashed lines mark the fronts of the pre-plasma. The thickness is 1.2 µm for both targets.
    Electron kinetic energy distributions for (a) and (b) aluminum and (c) and (d) plastic targets, both with thickness 8 µm, at t = 53 fs (i.e., 20T0) and t = 80 fs (i.e., 30T0).
    Fig. 4. Electron kinetic energy distributions for (a) and (b) aluminum and (c) and (d) plastic targets, both with thickness 8 µm, at t = 53 fs (i.e., 20T0) and t = 80 fs (i.e., 30T0).
    Magnitude of the electric field as a function of time and position for (a) aluminum and (b) plastic targets, both with thickness 8 µm. As indicated by the dashed line in Fig. 4, the electric field is along the normal direction of the back-side surface, starting at z = 17 µm and y = 0 µm.
    Fig. 5. Magnitude of the electric field as a function of time and position for (a) aluminum and (b) plastic targets, both with thickness 8 µm. As indicated by the dashed line in Fig. 4, the electric field is along the normal direction of the back-side surface, starting at z = 17 µm and y = 0 µm.
    Magnitude of the electric field as a function of time and position for aluminum targets of thickness (a) 2 µm and (b) 8 µm. As indicated by the dashed line in Fig. 4, the electric field is along the normal direction of the back-side surface, starting at z = 17 µm and y = 0 µm.
    Fig. 6. Magnitude of the electric field as a function of time and position for aluminum targets of thickness (a) 2 µm and (b) 8 µm. As indicated by the dashed line in Fig. 4, the electric field is along the normal direction of the back-side surface, starting at z = 17 µm and y = 0 µm.
    (a) and (b) Spatial distribution and (c) and (d) angular distribution of proton energies for aluminum and plastic targets, both of thickness 2 µm, at t = 320 fs (i.e., 120T0). The angle ϕ is defined as ϕ = arctan(uy/uz) − θt, where θt is the target dip angle, which is 30°, and uy and uz are the proton momenta.
    Fig. 7. (a) and (b) Spatial distribution and (c) and (d) angular distribution of proton energies for aluminum and plastic targets, both of thickness 2 µm, at t = 320 fs (i.e., 120T0). The angle ϕ is defined as ϕ = arctan(uy/uz) − θt, where θt is the target dip angle, which is 30°, and uy and uz are the proton momenta.
    Y. X. Geng, D. Wu, W. Yu, Z. M. Sheng, S. Fritzsche, Q. Liao, M. J. Wu, X. H. Xu, D. Y. Li, W. J. Ma, H. Y. Lu, Y. Y. Zhao, X. T. He, J. E. Chen, C. Lin, X. Q. Yan. Proton beams from intense laser-solid interaction: Effects of the target materials[J]. Matter and Radiation at Extremes, 2020, 5(6): 064402
    Download Citation