• Photonics Research
  • Vol. 8, Issue 5, 715 (2020)
Tianyue Hou1、†, Yi An1、†, Qi Chang1, Pengfei Ma1、3、*, Jun Li1, Liangjin Huang1, Dong Zhi2, Jian Wu1, Rongtao Su1, Yanxing Ma1, and Pu Zhou1、4、*
Author Affiliations
  • 1College of Advanced Interdisciplinary Studies, National University of Defense Technology, Changsha 410073, China
  • 2Hypervelocity Aerodynamics Institute, China Aerodynamics Research and Development Center, Mianyang 621000, China
  • 3e-mail: shandapengfei@126.com
  • 4e-mail: zhoupu203@163.com
  • show less
    DOI: 10.1364/PRJ.388551 Cite this Article Set citation alerts
    Tianyue Hou, Yi An, Qi Chang, Pengfei Ma, Jun Li, Liangjin Huang, Dong Zhi, Jian Wu, Rongtao Su, Yanxing Ma, Pu Zhou. Deep-learning-assisted, two-stage phase control method for high-power mode-programmable orbital angular momentum beam generation[J]. Photonics Research, 2020, 8(5): 715 Copy Citation Text show less
    Scheme of the DL-assisted, two-stage phase control method for CBC. SL, seed laser; PA, pre-amplifier; PM, phase modulator; CFAs, cascaded fiber amplifiers; HRM, highly reflective mirror; FL, focus lens; BS, beam splitter.
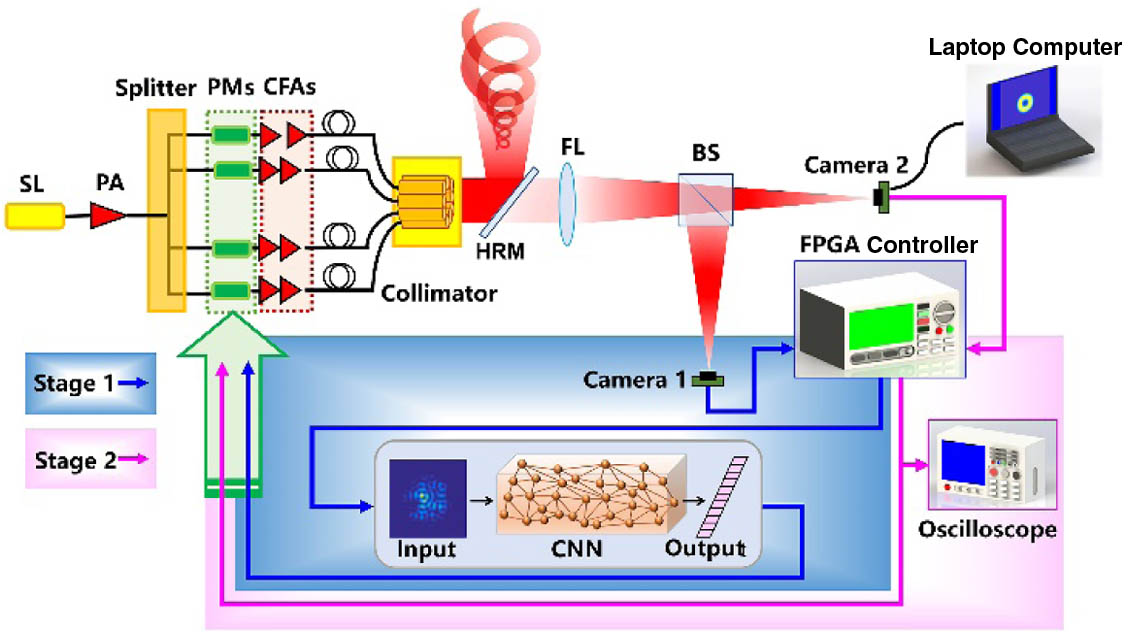
    Fig. 1. Scheme of the DL-assisted, two-stage phase control method for CBC. SL, seed laser; PA, pre-amplifier; PM, phase modulator; CFAs, cascaded fiber amplifiers; HRM, highly reflective mirror; FL, focus lens; BS, beam splitter.
    Schematic of the input radial laser array used for generating OAM beams.
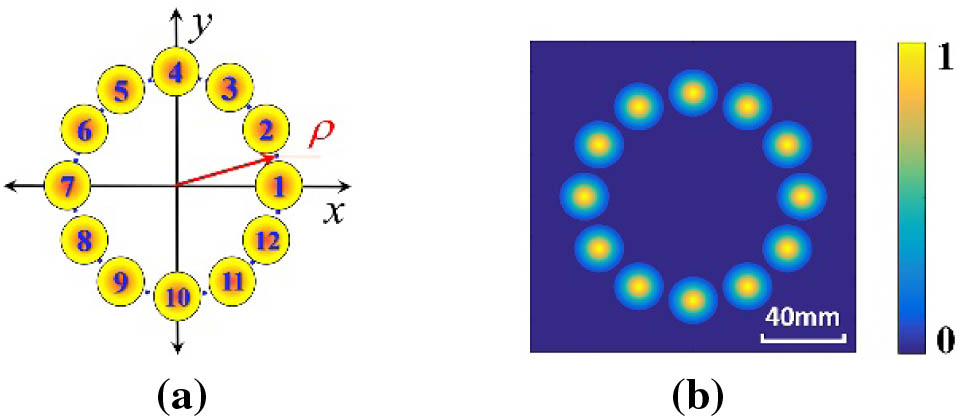
    Fig. 2. Schematic of the input radial laser array used for generating OAM beams.
    Average MSE of the CNN as a function of training epochs.
    Fig. 3. Average MSE of the CNN as a function of training epochs.
    Expected phase distributions of the laser array for generating (a) OAM −1, (b) OAM +1, (c) OAM −2, and (d) OAM +2 beams.
    Fig. 4. Expected phase distributions of the laser array for generating (a) OAM 1, (b) OAM +1, (c) OAM 2, and (d) OAM +2 beams.
    Performance of the first-stage phase compensation based on the DL network. (a1)–(a6) Intensity profiles and (b1)–(b6) phase distributions of the combined beams with random phase errors. (c1)–(c6) Intensity profiles and (d1)–(d6) phase distributions of the combined beams after first-stage phase compensation.
    Fig. 5. Performance of the first-stage phase compensation based on the DL network. (a1)–(a6) Intensity profiles and (b1)–(b6) phase distributions of the combined beams with random phase errors. (c1)–(c6) Intensity profiles and (d1)–(d6) phase distributions of the combined beams after first-stage phase compensation.
    Generalized “buckets” with κ=0.8 for calculating the cost function to generate (a) OAM ±1 and (b) OAM ±2 beams.
    Fig. 6. Generalized “buckets” with κ=0.8 for calculating the cost function to generate (a) OAM ±1 and (b) OAM ±2 beams.
    Generation of OAM beams. (a)–(d) Convergence curves of the cost functions for generating OAM −1, +1, −2, and +2 beams, respectively. One hundred simulations have been performed for each case. The inset figures show the average intensity (left) and phase (right) distributions of the generated OAM beams.
    Fig. 7. Generation of OAM beams. (a)–(d) Convergence curves of the cost functions for generating OAM 1, +1, 2, and +2 beams, respectively. One hundred simulations have been performed for each case. The inset figures show the average intensity (left) and phase (right) distributions of the generated OAM beams.
    Phases of the array elements during 100 simulations. From top to bottom, they are the laser array with random phase errors, after the first-stage phase compensation, and after the second-stage phase compensation. The first, second, third, and fourth columns correspond to the generation of OAM −1, OAM +1, OAM −2, and OAM +2 beams, respectively.
    Fig. 8. Phases of the array elements during 100 simulations. From top to bottom, they are the laser array with random phase errors, after the first-stage phase compensation, and after the second-stage phase compensation. The first, second, third, and fourth columns correspond to the generation of OAM 1, OAM +1, OAM 2, and OAM +2 beams, respectively.
    Analysis of the OAM mode purity of the truncated combined OAM −2 beams. From top to bottom, the rows show the average intensity profiles, the average phase distributions, and the average OAM-spectra. From left to right, the cases are with random phase errors, after the first-stage phase compensation, and after the second-stage phase compensation.
    Fig. 9. Analysis of the OAM mode purity of the truncated combined OAM 2 beams. From top to bottom, the rows show the average intensity profiles, the average phase distributions, and the average OAM-spectra. From left to right, the cases are with random phase errors, after the first-stage phase compensation, and after the second-stage phase compensation.
    Average OAM spectra of the truncated combined OAM beams before and after the second-stage phase control. (a1), (b1), (c1) Cases of the truncated combined OAM −1, OAM +1, and OAM +2 beams, respectively, before the second-stage phase control; (a2), (b2), (c2) cases of the truncated combined OAM −1, OAM +1, and OAM +2 beams, respectively, after the second-stage phase control.
    Fig. 10. Average OAM spectra of the truncated combined OAM beams before and after the second-stage phase control. (a1), (b1), (c1) Cases of the truncated combined OAM 1, OAM +1, and OAM +2 beams, respectively, before the second-stage phase control; (a2), (b2), (c2) cases of the truncated combined OAM 1, OAM +1, and OAM +2 beams, respectively, after the second-stage phase control.
    Tianyue Hou, Yi An, Qi Chang, Pengfei Ma, Jun Li, Liangjin Huang, Dong Zhi, Jian Wu, Rongtao Su, Yanxing Ma, Pu Zhou. Deep-learning-assisted, two-stage phase control method for high-power mode-programmable orbital angular momentum beam generation[J]. Photonics Research, 2020, 8(5): 715
    Download Citation