• Spectroscopy and Spectral Analysis
  • Vol. 41, Issue 2, 658 (2021)
Y. Al-Humaidi Jehan1、1, A. Al-Saif Foziah1、1, N. Binjawhar Dalal1、1, A. Bakhsh Hanan1、1, and S. Refat Moamen1、1
Author Affiliations
  • 1[in Chinese]
  • 11. Department of Chemistry, College of Science, Princess Nourah bint Abdulrahman University, Riyadh 11671, Saudi Arabia
  • show less
    DOI: 10.3964/j.issn.1000-0593(2021)02-0658-07 Cite this Article
    Y. Al-Humaidi Jehan, A. Al-Saif Foziah, N. Binjawhar Dalal, A. Bakhsh Hanan, S. Refat Moamen. Synthesis, Spectroscopic Characterization, Thermogravimetric and Biological Activity Evaluation of Te(Ⅳ), Se(Ⅳ), V(Ⅲ), Nb(Ⅴ), Ta(Ⅴ) Complexes With Indole-3-Acetic Acid Plant Hormone Ligand[J]. Spectroscopy and Spectral Analysis, 2021, 41(2): 658 Copy Citation Text show less
    Structure of indole-3-acetic acid (IAAH)
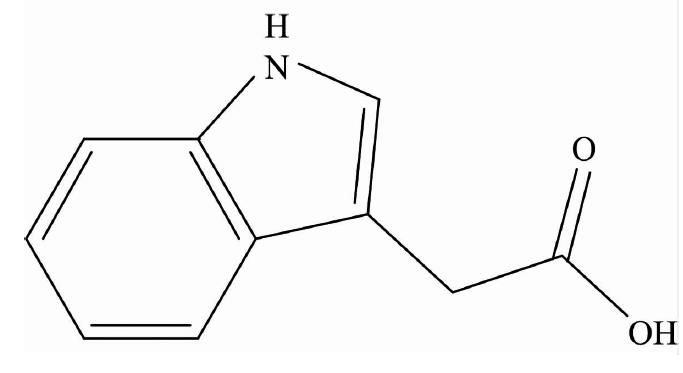
    Fig. 1. Structure of indole-3-acetic acid (IAAH)
    Suggested structures of IAA complexes
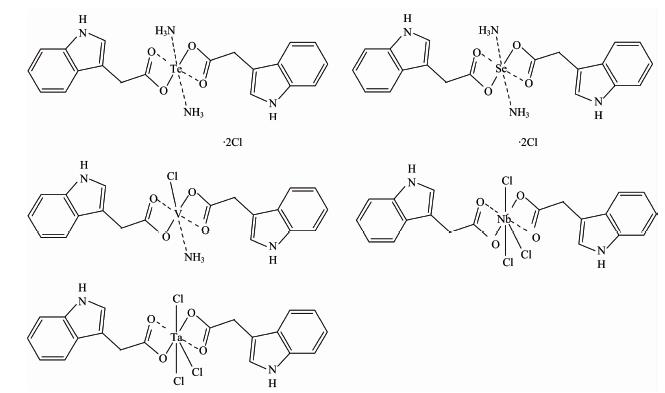
    Fig. 2. Suggested structures of IAA complexes
    FTIR spectra of IAA complexes Ⅰ—Ⅴ
    Fig. 3. FTIR spectra of IAA complexes Ⅰ—Ⅴ
    TG-DrTGA curve of [V(IAA)2(NH3)(Cl)] complex
    Fig. 4. TG-DrTGA curve of [V(IAA)2(NH3)(Cl)] complex
    XRD pattern of IAA complexes Ⅰ—Ⅴ
    Fig. 5. XRD pattern of IAA complexes Ⅰ—Ⅴ
    TEM images of (Ⅰ): tellurium and (Ⅳ): niobium complexes
    Fig. 6. TEM images of (Ⅰ): tellurium and (Ⅳ): niobium complexes
    SEM images of IAA complexes Ⅰ—Ⅴ
    Fig. 7. SEM images of IAA complexes Ⅰ—Ⅴ
    ComplexColorMagnetic
    moment (BM)
    Conductance/
    (ohm-1·cm2·mol-1)
    ElementCalc.Found
    Orange red-96%C41.3541.12
    %H3.823.77
    %N9.649.65
    %Cl12.2112.09
    Orange-105%C45.1345.03
    %H4.174.03
    %N10.5310.45
    %Cl13.3213.21
    Olive green1.1114%C53.1753.06
    %H4.244.11
    %N9.309.23
    %Cl7.857.70
    Yellow-10%C43.8743.65
    %H2.942.88
    %N5.125.06
    %Cl19.4219.35
    Yellow-12%C37.7937.81
    %H2.542.43
    %N4.414.38
    %Cl16.7316.60
    Table 1. Micro analytical and physical data of IAA complexes
    CompoundsFrequencies/cm-1
    ν(N—H)νas(COO)νs(COO)ν(M—O)ν(M—N)
    I3 4001 5491 403585, 517429
    3 4001 5501 403517429
    3 4001 5491 403595, 517419
    3 3901 5491 403634-
    3 4001 5491 403624-
    Table 2. Infrared spectral data (cm-1) of IAA complexes Ⅰ—Ⅴ
    AssignmentsCompounds
    IAAH
    1H, COOH12.16----
    1H, NH10.9110.90911.10010.90910.948
    5H, C6H4, C=CH7.51~6.976.914~7.4857.4737.2926.945~7.481
    2H, CH23.643.7213.4343.3533.728
    Table 3. 1HNMR spectral data (cm-1) of IAA and its complexes (Ⅰ, Ⅱ, Ⅳ, and Ⅴ)
    sampleInhibition zone diameter (mm·mg-1 sample)
    KlebsiellaEsherichia
    Coli
    Staphylococcus
    Epidermidis
    Staphylococcus
    Aureus
    Control: DMSO0.00.00.00.0
    StandardCeftriaxone
    Gentamycin
    0.0
    0.3
    0.0
    0.0
    1.6
    1.8
    1.9
    1.5
    0.20.00.00.0
    0.10.00.00.0
    0.20.00.00.0
    0.10.00.00.0
    0.10.00.00.0
    Table 4. Inhibition zone diameter of IAA complexes Ⅰ—Ⅴ against four bacterial strains
    Y. Al-Humaidi Jehan, A. Al-Saif Foziah, N. Binjawhar Dalal, A. Bakhsh Hanan, S. Refat Moamen. Synthesis, Spectroscopic Characterization, Thermogravimetric and Biological Activity Evaluation of Te(Ⅳ), Se(Ⅳ), V(Ⅲ), Nb(Ⅴ), Ta(Ⅴ) Complexes With Indole-3-Acetic Acid Plant Hormone Ligand[J]. Spectroscopy and Spectral Analysis, 2021, 41(2): 658
    Download Citation