• Acta Optica Sinica
  • Vol. 40, Issue 5, 0514002 (2020)
Lei Qi and Rongzhu Zhang*
Author Affiliations
  • College of Electronics and Information Engineering, Sichuan University, Chengdu, Sichuan 610064, China
  • show less
    DOI: 10.3788/AOS202040.0514002 Cite this Article Set citation alerts
    Lei Qi, Rongzhu Zhang. Damage Characteristics of Three-Junction GaAs Cell Under Combined Pulse Laser Irradiation[J]. Acta Optica Sinica, 2020, 40(5): 0514002 Copy Citation Text show less
    Schematic diagram for three-junction GaAs solar cell under laser irradiation
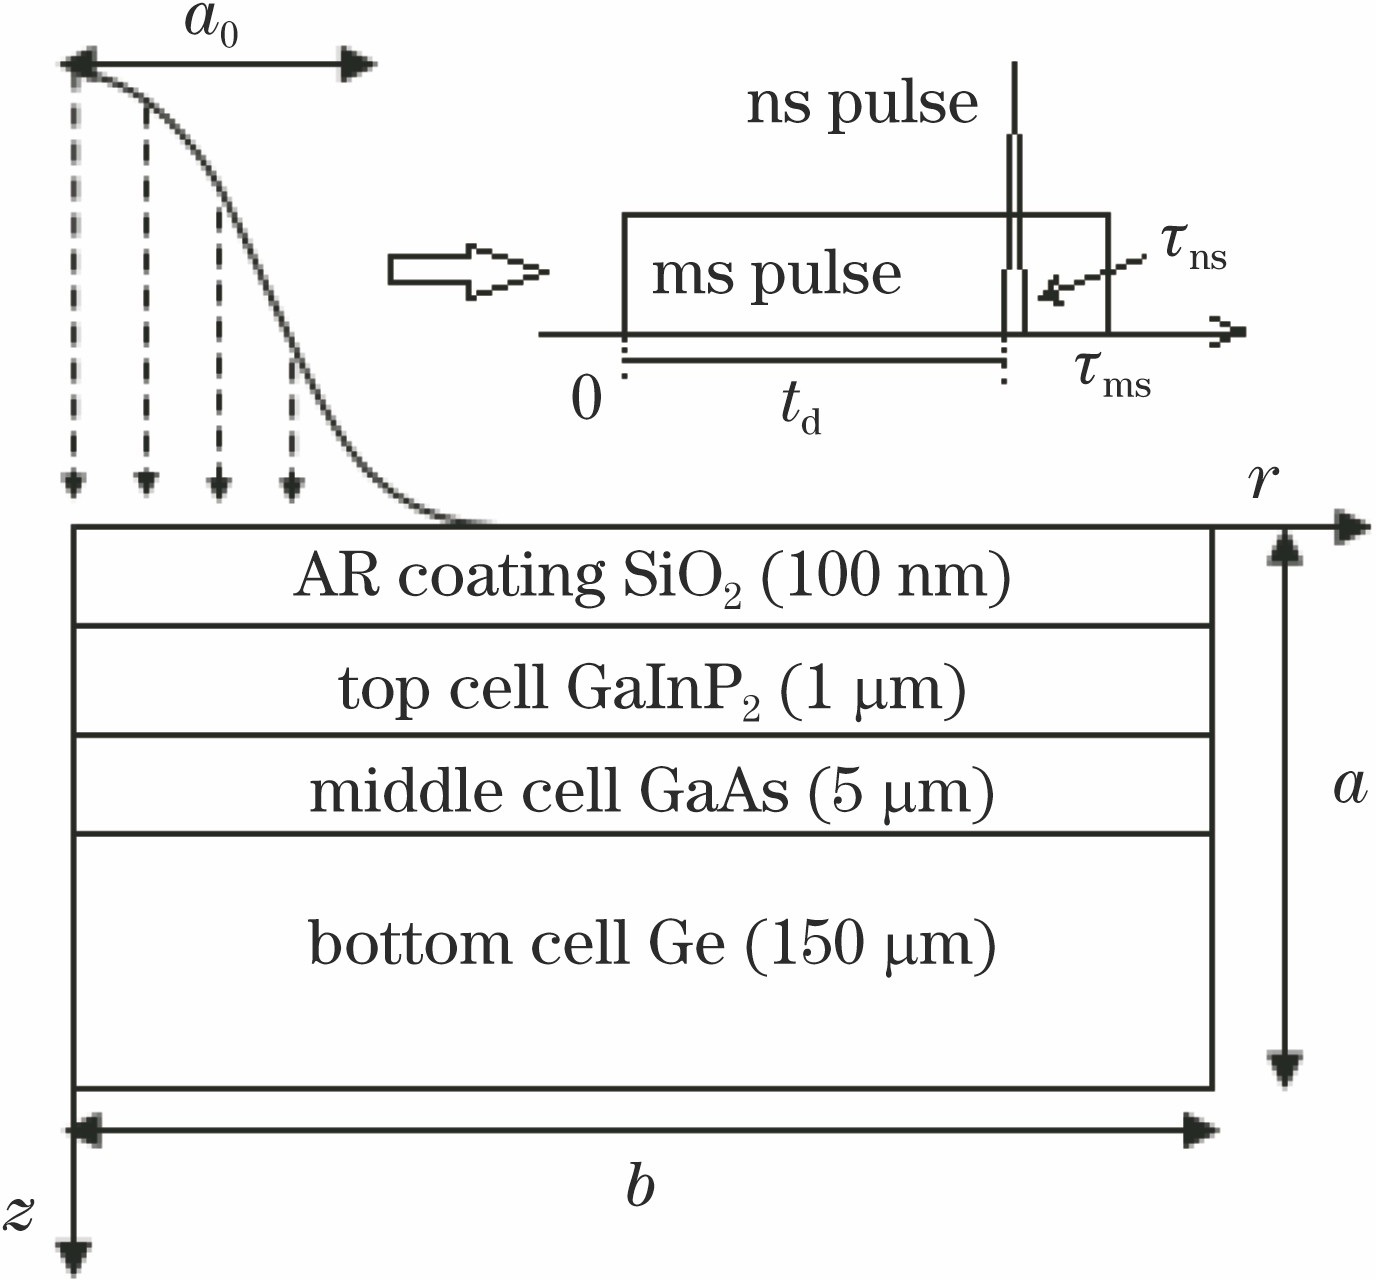
    Fig. 1. Schematic diagram for three-junction GaAs solar cell under laser irradiation
    Maximum temperature of solar cell as a function of time when action time delay of nanosecond laser is 0.3 ms. (a) Whole curves; (b)(c) partial enlarged details
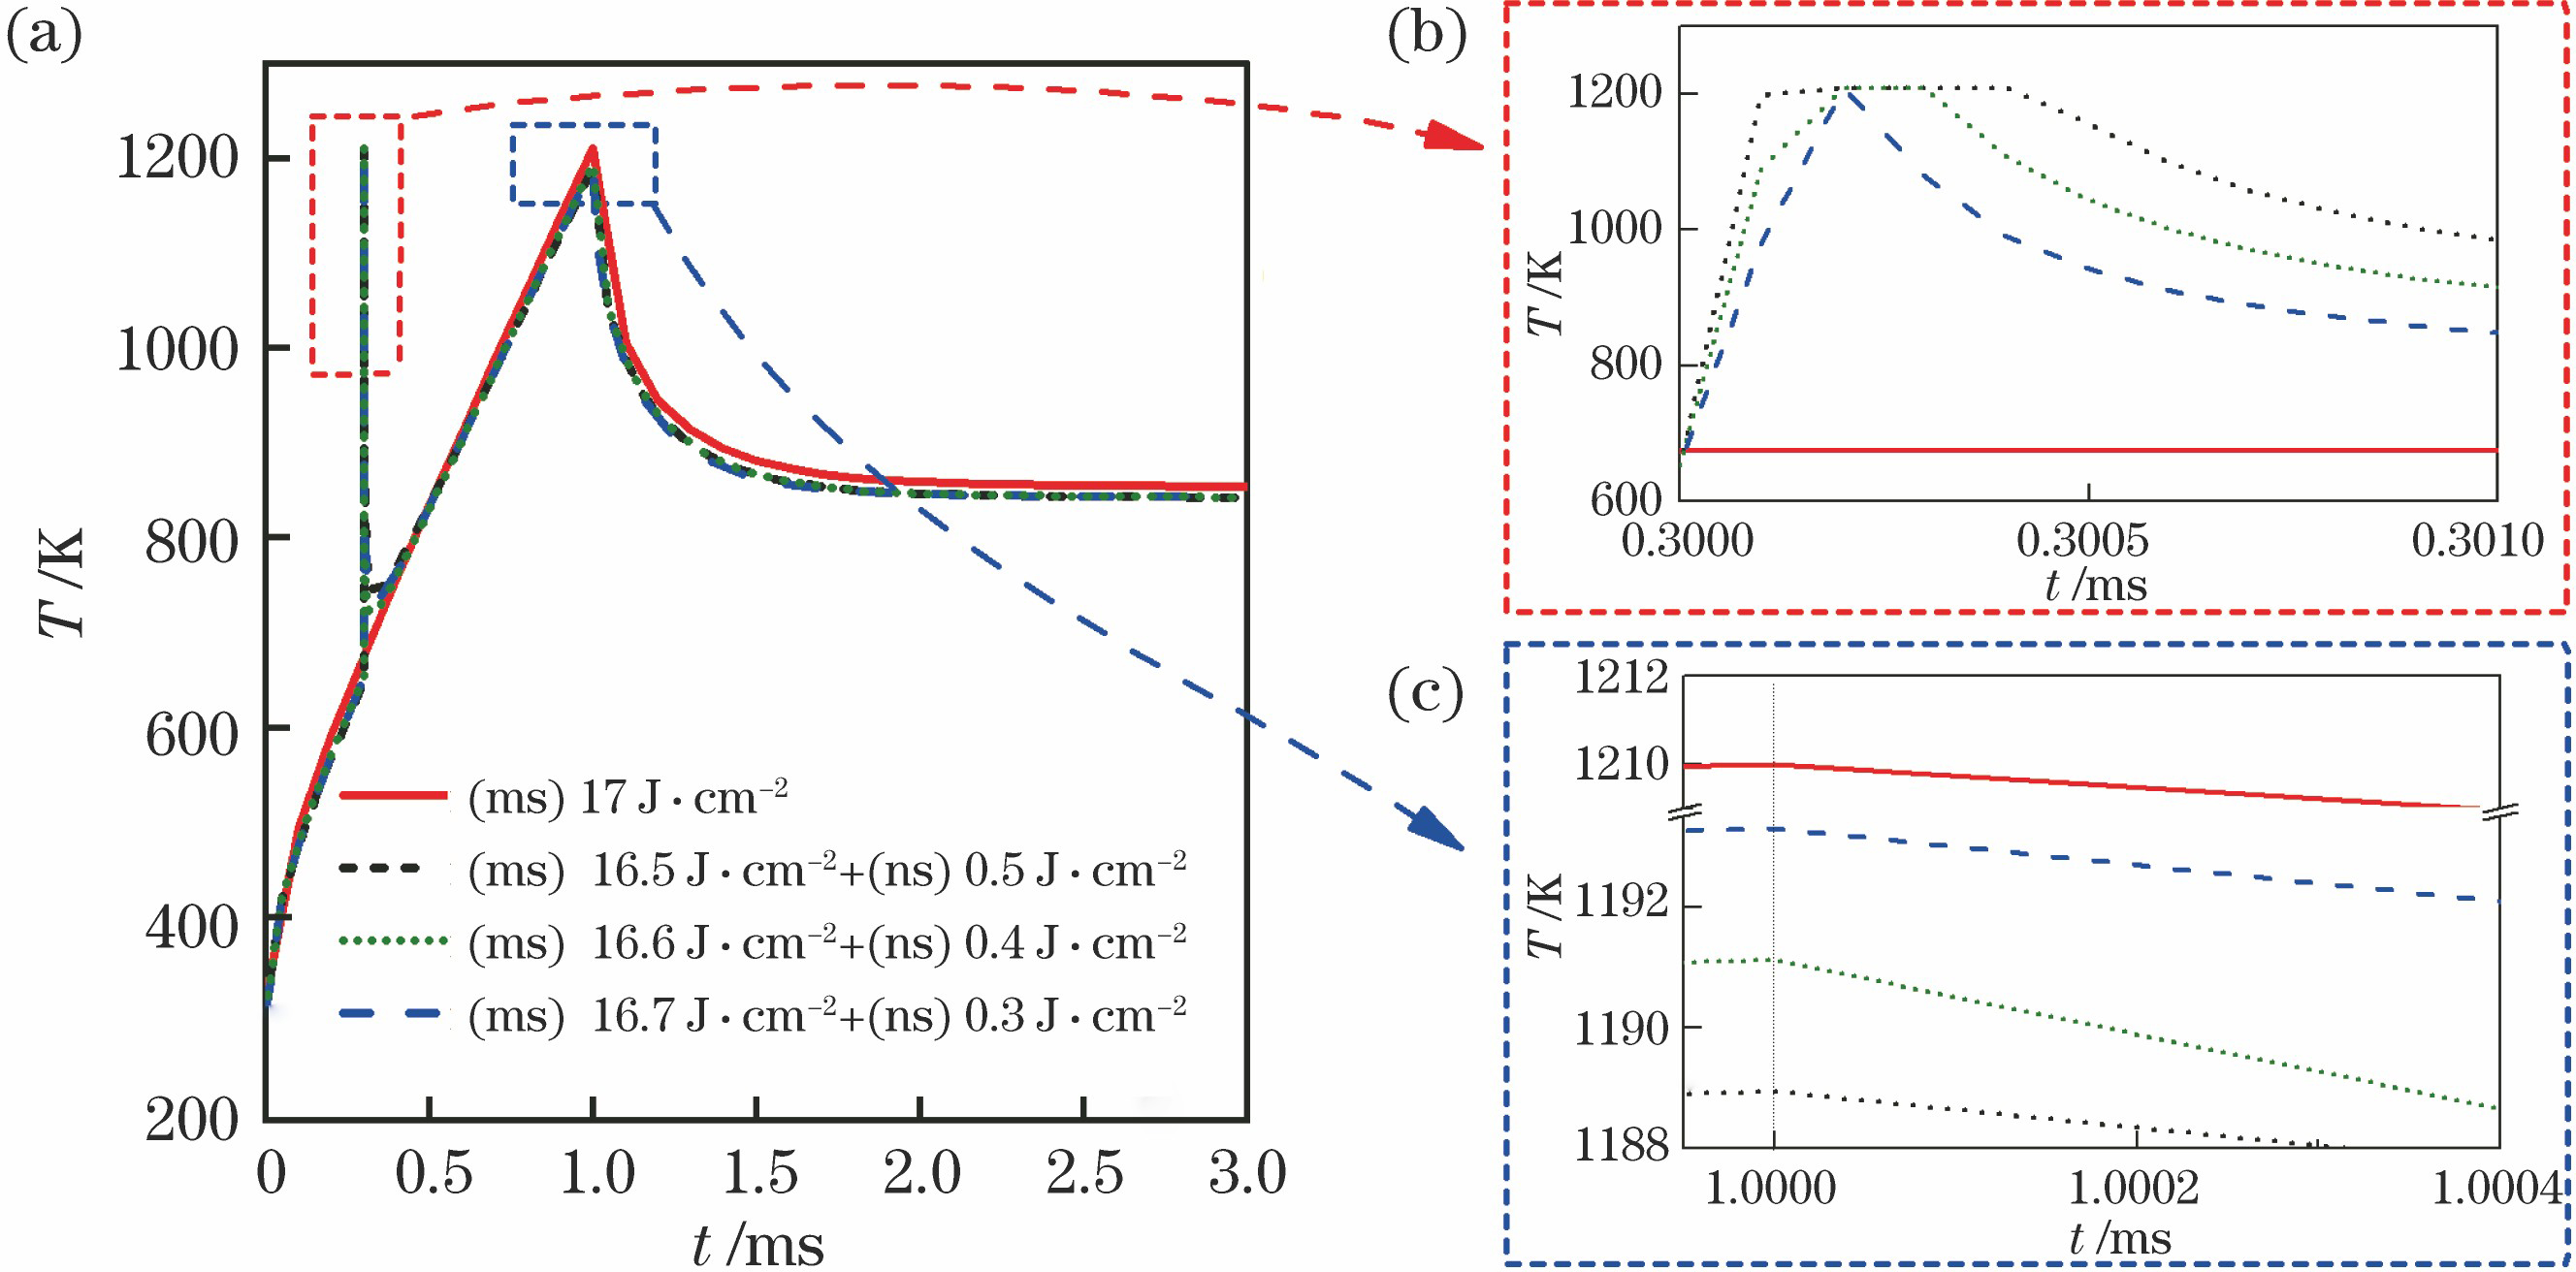
    Fig. 2. Maximum temperature of solar cell as a function of time when action time delay of nanosecond laser is 0.3 ms. (a) Whole curves; (b)(c) partial enlarged details
    Spatial distribution of temperature of solar cell when action time delay of nanosecond laser is 0.3 ms. (a) Radial distribution; (b) axial distribution and inset is partial detail
    Fig. 3. Spatial distribution of temperature of solar cell when action time delay of nanosecond laser is 0.3 ms. (a) Radial distribution; (b) axial distribution and inset is partial detail
    Spatial distribution of hoop stress. (a) Radial and (b) axial distributions before nanosecond laser irradiation; (c) radial and (d) axial distributions after nanosecond laser irradiation at delay time of 0.3 ms
    Fig. 4. Spatial distribution of hoop stress. (a) Radial and (b) axial distributions before nanosecond laser irradiation; (c) radial and (d) axial distributions after nanosecond laser irradiation at delay time of 0.3 ms
    Maximum temperature of solar cell as a function of time with different delay time. (a) Whole curves; (b)(c) partial details
    Fig. 5. Maximum temperature of solar cell as a function of time with different delay time. (a) Whole curves; (b)(c) partial details
    Spatial distribution of temperature with different delay time. (a) Radial distribution; (b) axial distribution and inset is partial detail
    Fig. 6. Spatial distribution of temperature with different delay time. (a) Radial distribution; (b) axial distribution and inset is partial detail
    Spatial distribution of hoop stress with different delay time. (a)(c) Radial distributions; (b)(d) axial distributions
    Fig. 7. Spatial distribution of hoop stress with different delay time. (a)(c) Radial distributions; (b)(d) axial distributions
    Materialρ /(kg·m-3)c /(J·kg-1·K-1)K /(W·cm-1·K-1)vE /(1010 Pa)γ /(10-6 K-1)Melting point /KTensile strength /Pa
    SiO2220010001.70.168.70.519801.4×107
    GaInP2447537050.338.25.316272.5×109
    GaAs5336T--0.0337T303+15×(T/300)42.5×(300/T)1.10.318.596.4940(decomposing)1510(melting)2.3×109
    Ge(solid)Ge(liquid)5343T--0.066T6137T--0.46T303+0.0613T38060×(300/T)14+0.029T0.2610.35.61210(melting)3100(sublimation)9.3×107
    Table 1. Thermodynamic parameters of each layer for three-junction GaAs solar cell[14-17]
    Lei Qi, Rongzhu Zhang. Damage Characteristics of Three-Junction GaAs Cell Under Combined Pulse Laser Irradiation[J]. Acta Optica Sinica, 2020, 40(5): 0514002
    Download Citation