• Photonics Research
  • Vol. 10, Issue 2, 509 (2022)
Xiaohan Wang1、†, Kunpeng Jia1、3、†,*, Mengwen Chen1, Shanshan Cheng1, Xin Ni1, Jian Guo1, Yihao Li1, Huaying Liu1, Liyun Hao1, Jian Ning1, Gang Zhao1, Xinjie Lv1, Shu-Wei Huang2, Zhenda Xie1、4、*, and Shi-Ning Zhu1
Author Affiliations
  • 1National Laboratory of Solid State Microstructures, School of Electronic Science and Engineering, School of Physics, College of Engineering and Applied Sciences, and Collaborative Innovation Center of Advanced Microstructures, Nanjing University, Nanjing 210093, China
  • 2Department of Electrical, Computer and Energy Engineering, University of Colorado Boulder, Boulder, Colorado 80309, USA
  • 3e-mail: jiakunpeng@nju.edu.cn
  • 4e-mail: xiezhenda@nju.edu.cn
  • show less
    DOI: 10.1364/PRJ.432076 Cite this Article Set citation alerts
    Xiaohan Wang, Kunpeng Jia, Mengwen Chen, Shanshan Cheng, Xin Ni, Jian Guo, Yihao Li, Huaying Liu, Liyun Hao, Jian Ning, Gang Zhao, Xinjie Lv, Shu-Wei Huang, Zhenda Xie, Shi-Ning Zhu. 2 μm optical frequency comb generation via optical parametric oscillation from a lithium niobate optical superlattice box resonator[J]. Photonics Research, 2022, 10(2): 509 Copy Citation Text show less

    Abstract

    Optical parametric oscillators (OPOs) can downconvert the pump laser to longer wavelengths with octave separation via χ(2), which is widely used for laser wavelength extension including mid-infrared (MIR) generation. Such a process can be integrated in monolithic resonators, being compact and low in threshold. In this work, we show that the monolithic χ(2) mini-OPO can also be used for optical frequency comb generation around 2096 nm and enters the boundary of MIR range. A new geometry called an optical superlattice box resonator is developed for this realization with near-material-limited quality factor of 4.0×10⁷. Only a continuous-wave near-infrared pump laser is required, with OPO threshold of 80 mW and output power up to 340 mW. Revival temporal profiles are measured at a detectable repetition frequency of 1.426 GHz, and narrow beat note linewidth of less than 10 Hz shows high comb coherence. These results are in good agreement with our simulation for a stable comb generation. Such an OPO-based comb source is useful for carbon dioxide sensing or the mine prospect applications and can be generalized to longer MIR wavelengths for general gas spectroscopy.

    1. INTRODUCTION

    The nonlinear optical frequency conversion process based on second-order nonlinearity can generate coherent radiations with new frequencies at octave separation with the pump, where efficient optical frequency downconversion can be achieved in an optical parametric oscillator (OPO) [115]. Such OPOs are of special importance to fulfill a specific wavelength requirement that is difficult for direct laser generation, for example, the mid-infrared (MIR) [16,17]. It also offers wide tunability by tailoring the phase-matching conditions, which is another important feature for spectroscopy applications [18,19]. Compared to the normal OPOs using bulk optics, mini-OPOs have been developed in a more compact and robust platform using monolithic optical resonators [2023]. Such mini-OPOs have been demonstrated using lithium niobate (LN), which is known for its high nonlinear optical coefficient in χ(2), especially together with domain engineering techniques using optical superlattice structures [2426]. With high quality factors and small mode volumes, these mini-OPO platforms enable ultralow threshold and efficient oscillation [22,23,26]. Besides the conventional single-frequency OPOs, the optical frequency combs (OFCs) may also be generated in mini-OPOs, and they can push the spectroscopy performance to a new level, in terms of both resolution and sampling speed, for trace gas detection, environmental monitoring, medical diagnostics, and so on [2730]. The OFCs in χ(2) OPOs have been demonstrated, using bulk optics or in monolithic resonators [3133]. However, the demonstration for pushing the comb wavelength to the MIR region has not been achieved in a mini-OPO, and high power capacity in a compact system is also important for remote sensing applications.

    In this work, we demonstrate an OFC generation at 2 μm from a χ(2) mini-OPO. Such a process is enabled by a new monolithic resonator design called an optical superlattice box resonator (OSBR). A doubly resonant condition is configured by the dielectric coating design on the OSBR facets, and it simplifies the phase matching for broadband OFC generation. The OSBR confines the light in a lithium niobate dielectric superlattice waveguide cavity sized 0.076  mm×0.484  mm×48.4  mm, with high quality factor (Q) of 4.0×10⁷. Pumping with a continuous-wave (CW) near-infrared (NIR) laser at 1048 nm, OFC around 2096 nm is generated with low OPO threshold of 80 mW and enters the boundary of MIR wavelength. The comb span exceeds 40 nm with maximum output power of 340 mW and conversion efficiency up to 12.4%. Consistently revival temporal waveforms can be captured, and good comb coherence is presented by narrow beat note linewidth of less than 10 Hz at a detectable repetition frequency of 1.426 GHz. The above spectral and temporal measurement results agree with our simulation, showing a stable χ(2) comb generation.

    2. OPTICAL SUPERLATTICE BOX RESONATOR

    A perfect electromagnetic resonator can be formed by a rectangular boundary over a dielectric medium, and such a box resonator is a popular model in textbooks [34]. For the optical wave, we use this old concept to realize a new structure of a high-Q OSBR. As shown in Fig. 1(a), all six surfaces of the OSBR are finely polished for transverse optical confinement by total internal reflection [3537], and the longitudinal confinement can be achieved by wavelength-selective optical coatings, which are designed to be doubly resonant for signal and idler wavelengths and single pass for the pump. Domain engineering is also incorporated in this device for flexible quasi-phase-matching (QPM).

    Schematic and characterization of an optical superlattice box resonator. (a) Structure of the OSBR. The optical superlattice “box” is sandwiched by lithium tantalate (LT) substrates, with an effective size of 0.484 mm×0.076 mm×48.4 mm. It confines the optical waves for the signal and idler from all six surfaces. (b) Fabrication process of the OSBR. The optical superlattice wafer is thinned to 0.076 mm by mechanical polishing and then sandwiched by LT substrates with Ta2O5 and SiO2 films as buffer layers. Then it is sliced and precisely polished for all the surfaces. Optical coatings are applied with wavelength selectivity: S1, AR at 1048 nm, R=99.8% at 2096 nm; S2, AR at 1048 nm, R=99% at 2096 nm. Finally, the OSBR is mounted in thermally conductive metal housing for thermal control. (c) Measured and simulated FSRs and dispersion of the TM00 mode as a function of wavelength. Small anomalous dispersion is fitted for OSBR at around 2100 nm. (d) OSBR transmission signal. The beam profile is fine adjusted to match the TM00 mode field so that only the TM00 mode can be excited efficiently. The inset is a zoom-in picture of one transmission peak of the TM00 mode with quality factor of 4.0×10⁷.

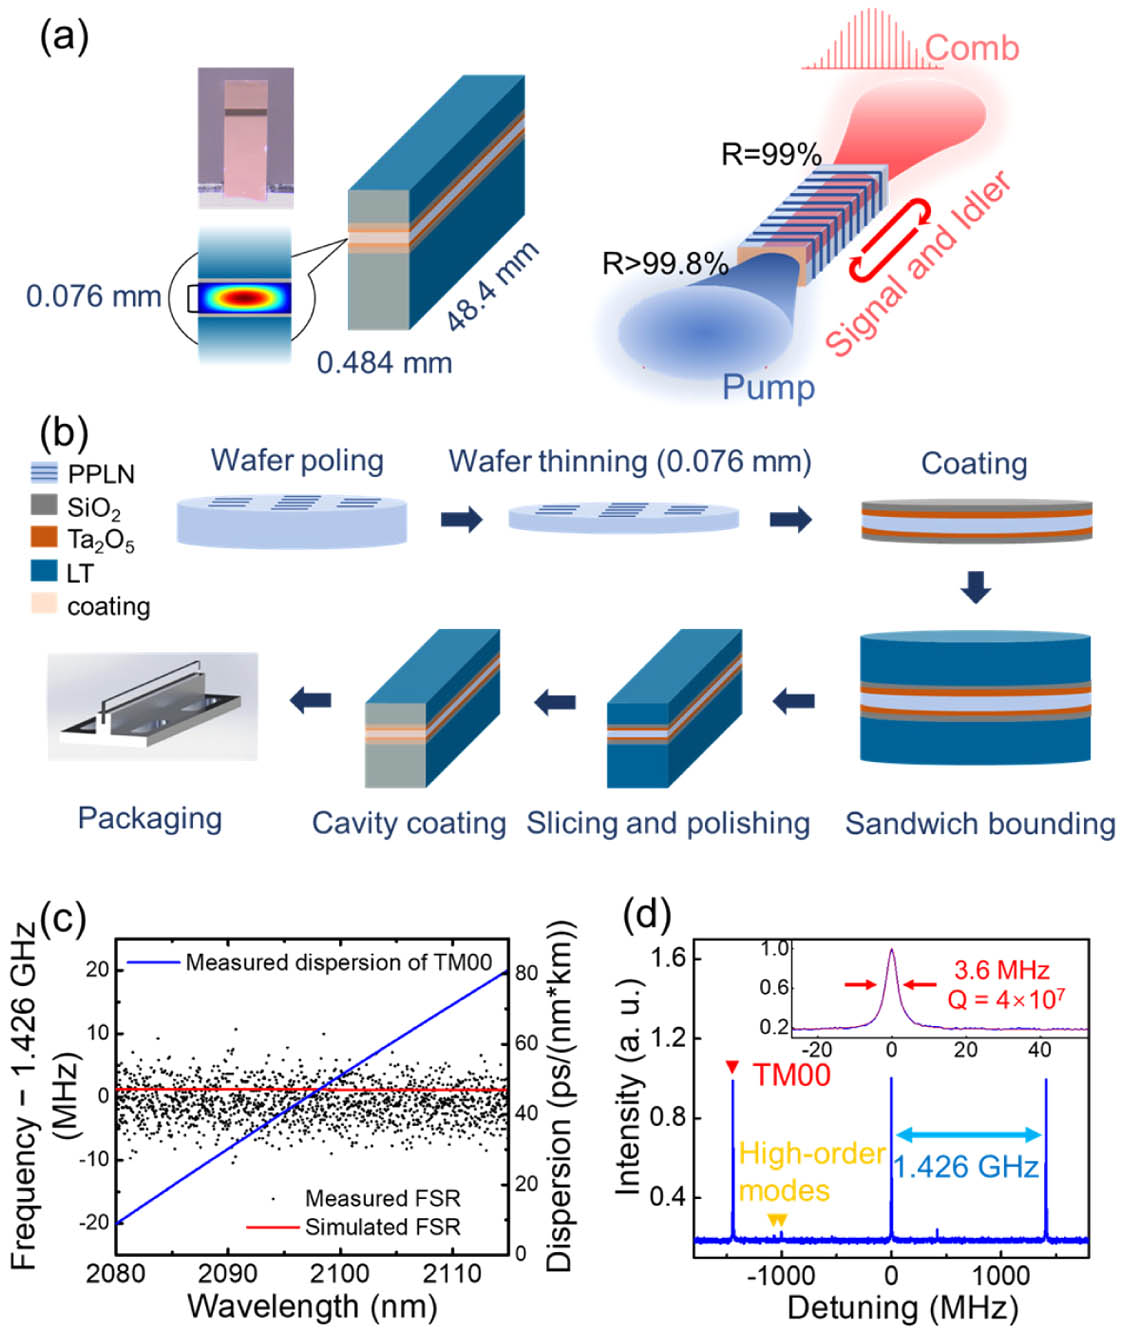
    Figure 1.Schematic and characterization of an optical superlattice box resonator. (a) Structure of the OSBR. The optical superlattice “box” is sandwiched by lithium tantalate (LT) substrates, with an effective size of 0.484mm×0.076mm×48.4mm. It confines the optical waves for the signal and idler from all six surfaces. (b) Fabrication process of the OSBR. The optical superlattice wafer is thinned to 0.076 mm by mechanical polishing and then sandwiched by LT substrates with Ta2O5 and SiO2 films as buffer layers. Then it is sliced and precisely polished for all the surfaces. Optical coatings are applied with wavelength selectivity: S1, AR at 1048 nm, R=99.8% at 2096 nm; S2, AR at 1048 nm, R=99% at 2096 nm. Finally, the OSBR is mounted in thermally conductive metal housing for thermal control. (c) Measured and simulated FSRs and dispersion of the TM00 mode as a function of wavelength. Small anomalous dispersion is fitted for OSBR at around 2100 nm. (d) OSBR transmission signal. The beam profile is fine adjusted to match the TM00 mode field so that only the TM00 mode can be excited efficiently. The inset is a zoom-in picture of one transmission peak of the TM00 mode with quality factor of 4.0×10⁷.

    The fabrication process is shown in Fig. 1(b). It starts from the optical superlattice fabrication over a 76.2-mm-diameter MgO-doped LN wafer with our whole wafer poling technique. Then this wafer is polished down to a thickness of 76 μm with subnanometer surface roughness and coated with 110 nm Ta2O5 cladding layers to minimize the MIR absorption, followed by 200 nm SiO2 layers for crystal bounding. Lithium tantalate (LT) substrates are used to sandwich the optical superlattice wafer for easy handling and thermal management. After slicing and fine polishing, the OSBR can be fabricated with coatings on the two small facets, with 99.8% and 99% reflection, respectively, at around 2096 nm, and antireflection at 1048 nm. Each resonator is mounted in a thermally conductive metal housing for precise temperature control.

    The poling period of the OSBR is 31.8 μm for the QPM optical parametric downconversion process from 1048 to 2096 nm. This process is chosen for comb generated at small anomalous dispersion wavelength of the resonator. To characterize the dispersion and Q of OSBR, we build a laser with large mode-hop-free tuning range at around 2100 nm by difference frequency generation (DFG) using a bulk periodically poled lithium niobate (PPLN) crystal. The DFG output is generated using a CW Ti-sapphire laser (M Squared SolsTiS) and an erbium-doped fiber amplified tunable semiconductor laser (TSL, Santec TSL-710). With the Ti-sapphire laser fixed at 890.47 nm, we sweep the wavelength of the TSL over a 20 nm range with a tuning rate of 100 nm/s, which corresponds to 37 nm DFG tuning around 2100 nm. A hydrogen cyanide (HCN) gas cell and a fiber Mach–Zehnder interferometer (MZI) are used for absolute wavelength calibration and linearizing the scan, respectively. With this DFG setup, we can scan the 2 μm laser across the cavity resonances with 37 nm span, and dispersion of the TM00 mode can be measured from the wavelength-dependent free spectral range (FSR) [Fig. 1(c)]. The measurement agrees well with the finite element simulation results, showing a small anomalous dispersion around 2100 nm. When scanning the 2 μm laser across the resonances, some higher-order modes can be well distinguished as shown in Fig. 1(d). In experiment, because of the relatively lower Q of the high-order modes, most of them can be well suppressed, and the fundamental mode holds the highest transmission. The FSR of the OSBR is measured to be about 1.426 GHz, and it agrees with its 48.4 mm cavity length. The inset shows a zoom-in of the fundamental-mode resonance, and its linewidth is fitted to be 3.6 MHz full width at half-maximum (FWHM), which corresponds to a Q of 4.0×10⁷. We focus on the fundamental mode for the following study.

    3. 2  μm COMB GENERATION

    In experiment, the pump light is from an ytterbium-doped fiber amplifier (YDFA), which is seeded by a CW tunable laser (Toptica CTL 1050). As shown in Fig. 2(a), a small portion of the pump is reflected by a 4% beam splitter for frequency and power stabilization. A wavelength meter (HighFinesse WS-U) is used to stabilize the frequency of seed laser, and a long-term stability within 1.5 MHz at around 1048 nm is achieved. The intensity noise from the YDFA is suppressed using a proportional-integral-derivative (PID) feedback loop to reduce the absorption-induced thermal fluctuation on the resonances of the OSBR. The pump beam is then directed through a set of cylindrical lenses to match the mode profile of the resonator. The OSBR is placed in a doubly enclosed metal mount, where the mount and internal enclosure are thermally stabilized using a Peltier cooler, with the isolation from the external enclosure. Submillikelvin temperature stability can be achieved by high-performance temperature controllers. A pump-rejection filter is used after the resonator to separate the residue pump light from the output.

    Experimental setup and output power tuning measurement of OSBR. (a) Experimental setup for 2 μm OFC generation. TSL, tunable semiconductor laser; YDFA, ytterbium-doped fiber amplifier; CLs, cylindrical lenses; PD, photodetector; BS, beam splitter; PBS, polarization beam splitter; ESA, electronic spectrum analyzer. (b) The output power of the 2 μm OFC as a function of the pump power. The measured maximum output power exceeds 0.34 W with an OPO threshold of 80 mW and a maximum conversion efficiency of 12.4%.

    Figure 2.Experimental setup and output power tuning measurement of OSBR. (a) Experimental setup for 2 μm OFC generation. TSL, tunable semiconductor laser; YDFA, ytterbium-doped fiber amplifier; CLs, cylindrical lenses; PD, photodetector; BS, beam splitter; PBS, polarization beam splitter; ESA, electronic spectrum analyzer. (b) The output power of the 2 μm OFC as a function of the pump power. The measured maximum output power exceeds 0.34 W with an OPO threshold of 80 mW and a maximum conversion efficiency of 12.4%.

    For our OSBR-based doubly resonant OPO, the pump intensity required to reach the oscillation threshold can be expressed as [38] Ith=cε0npnsniλsλiαsαi32π2L2deff2,where c, ε0, and λ are the speed of light, dielectric constant, and wavelength in a vacuum, respectively; n and deff=14.8  pm/V are the refractive index and effective nonlinear coefficient of LN, respectively; the subscripts p, s, i represent pump, signal, and idler waves; α is the fractional round-trip power loss for the resonant wave; and L is the length of the box resonator. In spite of the large mode size, the threshold is calculated to be as low as 22 mW. In the experiment, the power of the 2 μm output as a function of pump power is shown in Fig. 2(b), matching well with the simulation. The OPO is observed with a low threshold of about 80 mW, which is higher than the calculated value. We assume such deviation may result from the mode mismatching between pump and parametric waves in the OSBR as well as the loss in free-space optics for laser coupling, leading to an effective pump coupling loss of 72.5%. The maximum output power of 340 mW can be measured at 6.5 W pump, and the maximum conversion efficiency of 12.4% can be calculated at 0.23 W pump.

    We couple the 2 μm output into a single-mode fiber for further spectral and temporal studies. By increasing the pump power over 300 mW and slightly changing the pump detuning, a comb-like spectrum can be captured with an optical spectrum analyzer (OSA, Yokogawa AQ6375). At pump power of 6 W, a comb span of about 40 nm around 2096 nm can be observed [upper panel of Fig. 3(a)]. The discrepancy between simulated and experimental results may arise from the imperfect degenerate parametric downconversion due to the fluctuation of OSBR temperature or pump laser wavelength. By slightly changing the pump detuning toward the blue side, two peaks appear in the comb spectrum, and the separation between these two peaks continues to increase with the detuning [Figs. 3(b) and 3(c)]. Due to the limited spectral resolution of the OSA, which is larger than the comb line spacing, only the comb envelope can be resolved. The abovementioned comb spectral measurement can be simulated with good agreement in both comb spans and envelope profiles. The gray curves in Figs. 3(a)–3(c) are simulated with 0.6, 4.3, and 11 MHz pump frequency detuning, respectively, at 6 W pump power. The whole picture of the comb spectrum evolution is simulated as shown in Fig. 3(d) and further confirms the experimental observations. A single-peak comb envelope around wavelength degeneracy can be achieved with red detuning from 4 to 0 MHz, and it splits into two peaks at blue detuning. The abovementioned results also show similar tendency in comparison to earlier works with bulk crystals and second-harmonic OFC generation [39,40].

    Study of optical and RF spectra of the 2 μm OFC. (a), (b), (c) The optical spectra of the OFC. The red curves show the measured comb spectra with different pump frequency detuning around 1048 nm and pump power of 6 W. The gray curves show the simulated spectra at stable comb states with 6 W pump power and at −0.6, 4.3, and 11 MHz pump frequency detuning, respectively. The lower panel of (a) is the spectrum in linear scale at −0.6 MHz pump frequency detuning. (d) Map of simulated comb spectra as a function of the pump frequency detuning with 6 W pump power. The highly coherent comb spectrum appears in detuning range from −4 to 0 MHz as a single peak envelope profile; it splits into two peaks at blue detuning, and the separation increases with the detuning. (e) RF beat note spectrum of 2 μm OFC. (f) RF beatnote spectrum around repetition frequency at 1.426 GHz, which shows a clean peak with low noise level. The further zoomed-in result shows a resolution bandwidth (RBW) limited linewidth of 10 Hz (at −3 dB level).

    Figure 3.Study of optical and RF spectra of the 2 μm OFC. (a), (b), (c) The optical spectra of the OFC. The red curves show the measured comb spectra with different pump frequency detuning around 1048 nm and pump power of 6 W. The gray curves show the simulated spectra at stable comb states with 6 W pump power and at 0.6, 4.3, and 11 MHz pump frequency detuning, respectively. The lower panel of (a) is the spectrum in linear scale at 0.6  MHz pump frequency detuning. (d) Map of simulated comb spectra as a function of the pump frequency detuning with 6 W pump power. The highly coherent comb spectrum appears in detuning range from 4 to 0 MHz as a single peak envelope profile; it splits into two peaks at blue detuning, and the separation increases with the detuning. (e) RF beat note spectrum of 2 μm OFC. (f) RF beatnote spectrum around repetition frequency at 1.426 GHz, which shows a clean peak with low noise level. The further zoomed-in result shows a resolution bandwidth (RBW) limited linewidth of 10 Hz (at 3  dB level).

    The coherence of the 2 μm OFC is characterized with radio frequency (RF) measurements. A fast InGaAs detector (EOT ET-5000A) with RF bandwidth of 20 kHz to 10 GHz is used to detect the photon current generated by the whole comb output. The RF spectrum is measured by an electronic spectrum analyzer (ESA, R&S FSVA30), with results shown in Fig. 3(e). At proper pump detuning, clean beat note peaks can be captured at integer number times of the repetition frequency at 1.426 GHz, which is close to the cavity FSR of the 48.4 mm long box resonator. Figure 3(f) shows a zoom-in of the RF spectrum around the repetition frequency, with low noise level and a narrow 3  dB linewidth of less than 10 Hz. Such results indicate that the generated comb features consistent repetition rate over the whole comb span with low noise.

    We also study the temporal behavior of the OFC using a fast oscilloscope (Tektronix MSO71604C) with 16 GHz bandwidth. As shown in Fig. 4(a) and zoomed-in in 4(b), the temporal waveforms can be observed with good repeatability. We plot the traces of 285 round trips stacked together in one round-trip time window of about 0.701 ns. As shown in Fig. 4(c), they match well with each other, with a standard deviation of less than 1.1%. They also match the time-domain simulation, with 6 W pump power and 0.6  MHz detuning, by considering the photodetector’s bandwidth limitation (20 kHz to 10 GHz) in the numerical process. The simulated temporal profile is shown in Fig. 4(d) and zoomed-in in 4(e). Their good agreement reveals a coherent and stable OFC generation from our OSBR. For a better understanding of this comb state, we simulate the corresponding temporal evolution in 20,000 round trips of the parametric field without RF bandwidth limitation. As shown in Fig. 4(f), a stable temporal waveform can be simulated after 8000 round trips (5600 ns). It is in a pulse-like shape that is not transform limited but has good repeatability. Figure 4(g) shows the corresponding spectral evolution, which also confirms a stable comb generation.

    Study of temporal waveforms and evolution of the 2 μm χ(2) OFC. (a) The captured temporal waveform of 285 round trips in the time domain. (b) Zoom-in of 10 ns temporal waveform, showing a pulse train with a repetition period of 0.701 ns. (c) Stack plot of 285 round trips within one repetition period, which shows good repeatability with a standard deviation of less than 1.1 %. (d), (e) The simulated pulse train in the time domain within 10 ns and one round trip considering the RF bandwidth limit of the photodetector. They agree well with the experimental results shown in (b) and (c) in comparison, respectively. (f) Temporal evolution simulation for the OFC without RF filtering. A stable temporal pattern is generated after 8000 round trips. The inset of (f) shows a pulse-like temporal waveform in the steady state. (g) The corresponding spectral evolution map. It also shows a stable comb generation. All simulations in (d)–(g) are performed under pump power at 6 W and detuning at −0.6 MHz, for best agreement with the experimental results.

    Figure 4.Study of temporal waveforms and evolution of the 2 μm χ(2) OFC. (a) The captured temporal waveform of 285 round trips in the time domain. (b) Zoom-in of 10 ns temporal waveform, showing a pulse train with a repetition period of 0.701 ns. (c) Stack plot of 285 round trips within one repetition period, which shows good repeatability with a standard deviation of less than 1.1 %. (d), (e) The simulated pulse train in the time domain within 10 ns and one round trip considering the RF bandwidth limit of the photodetector. They agree well with the experimental results shown in (b) and (c) in comparison, respectively. (f) Temporal evolution simulation for the OFC without RF filtering. A stable temporal pattern is generated after 8000 round trips. The inset of (f) shows a pulse-like temporal waveform in the steady state. (g) The corresponding spectral evolution map. It also shows a stable comb generation. All simulations in (d)–(g) are performed under pump power at 6 W and detuning at 0.6  MHz, for best agreement with the experimental results.

    4. NUMERICAL MODELING

    Numerical modeling is studied in comparison to the experimental results. The simulation model we use is based on the solution of coupled wave equations as shown below, which is generally used for OPO studies and is also capable of the χ(2) OPO comb generation process with minimum approximation as discussed here: (z+βpt+iγp22t2)Ep=αpEp+iωpdeffnpcEsEieiΔkz,(z+βst+iγs22t2)Es=αsEs+iωsdeffnscEpEi*eiΔkz,(z+βit+iγi22t2)Ei=αiEi+iωideffnicEpEs*eiΔkz.

    The subscripts p, s, and i represent pump, signal, and idler waves, respectively. α, deff=14.8  pm/V, and n(ω) are the propagation loss, the effective nonlinear coefficient, and the frequency-dependent refractive index of the MgO-doped lithium niobate [41], respectively. Δk is the phase mismatch for the carrier frequencies, which is defined by Δk=kpkski2π/Λ, where Λ is the poling period of PPLN. The carrier frequencies satisfy the energy conservation ωp=ωs+ωi. β is related to the group velocity by vg=1/β=c/ng, and γ is the group velocity dispersion. Both of them can be derived from n(ω).

    The boundary conditions can be described as follows: Ejout(t,z=0)=1RjEjcirc(t,z=L)eiϕjRjEjin(t,z=0),Ejcirc(t,z=0)=1RjEjin(t,z=0)+RjEjcirc(t,z=L)eiϕj,where Eout, Ecirc, and Ein are the amplitude of output field and the circulating field in the cavity and input field, respectively. j=p, s, i represent the pump, signal, and idler waves. Rj, L, and ϕj are the equivalent reflectivity of the coupling mirrors, the cavity round-trip length, and the round-trip phase detuning. z=0 and z=L represent the front and rear boundaries of a round trip, respectively.

    We use the split-step Fourier and fourth-order Runge–Kutta methods [42] to simplify Eq. (2), where the OPO process is split into small alternating steps in two types, with nonlinear interaction and linear propagation, respectively. In this simplification, the linear step is calculated in the frequency domain, while the nonlinear step is calculated in the time domain, and the Fourier transform is performed between such two types of steps for continuous simulation.

    Taking the signal field as example, in the linear propagation step (z+βst+iγs22t2+αs)Es=0,a coordinate transformation is performed to a reference frame that is moving with a speed of vm, where m stands for the fastest wave among pump, signal, and idler. Performing a Fourier transformation into the frequency domain, and substituting /t with iω, Eq. (4) can be written as [z+iω(1vs1vm)iω2γs2+αs]Es=(zD^)Es=0,where we define the linear transmission operator D^ for the abovementioned linear propagation effect inside the OSBR.

    The three-wave coupling in Eq. (2) is simulated in the nonlinear interaction step, which is denoted by the nonlinear operator N^: N^Es=Esz=iωsdeffnscEpEi*eiΔkz.

    Thus, the field evolution after every step size Δh can be written as Esz=(N^+D^)Es,which can be solved as Ep,s,i(z+Δh,t)FT1exp(ΔhD^)FTexp(ΔhN^)Ep,s,i(z,t).

    The pump and idler fields can be derived in a similar way.

    Here, in our 48.4 mm long OSBR, we have a maximum bandwidth on the order of 10 THz for the parametric lights. Considering the bandwidth of the generated comb and the computer processing speed, sub-100-fs temporal resolution is used in the simulation.

    For the signal and idler light fields, we consider the OSBR’s front facet to be totally reflective and the rear facet to be with a reflectivity of 98.5 % (corresponding to the measured quality factor of 4×10⁷ and assuming αp,i,s=0). Both facets are simulated to have 100 % transmission for pump light. The initial signal and idler light fields are set as quantum noise. The pump frequency detuning is determined by the frequency difference between ωp/2 and its closest cavity resonance.

    We find that the buildup for the OPO process requires about 8000 round trips in the 48.4 mm long OSBR before reaching a steady state. So comb characterization is performed after this build-up time in all the simulations. Here we study the comb coherence at different pump frequency detunings and pump powers. The comb coherence is characterized by the temporal deviation function Dcomb: Dcomb=1Ccorr(T)=1tRtRr(t)s(tT)dttRtR|r(t)|2dttRtR|s(t)|2dt,where Dcomb can be derived from the cross correlation Ccorr(T) between the temporal waveform of one round trip r(t) and that of another round trip s(t). tR is the round trip time, and T is the integer time of tR. In the ideal case of a coherent comb, the temporal waveform should repeat itself at the period of tR, for Ccorr(T) and Dcomb approaching 1 and 0, respectively.

    Figures 5(a) and 5(b) show the temporal deviation of amplitude and phase, respectively, as a function of pump frequency detuning and pump power. The temporal deviation is calculated from the cross correlation between the 1400 round trips of successive temporal waveforms after 8600-round-trip evolution for reaching a steady state. We sweep the pump power from 0.25 W to 10 W and detuning from 10 to 4 MHz. A highly coherent state can be reached with a small deviation in red detuning range from 4 to 0 MHz, and the amplitude/phase deviation increases rapidly while detuning changes from red to blue.

    Numerical modeling of comb generation in OSBR. (a), (b) Maps of simulated temporal deviation of (a) amplitude and (b) phase at different pump power and frequency detuning. (c) Simulated comb spectra at different pump wavelengths. The degenerate wavelength and corresponding GVD are marked in each case. The broadest comb span can be achieved around zero-dispersion wavelength of OSBR.

    Figure 5.Numerical modeling of comb generation in OSBR. (a), (b) Maps of simulated temporal deviation of (a) amplitude and (b) phase at different pump power and frequency detuning. (c) Simulated comb spectra at different pump wavelengths. The degenerate wavelength and corresponding GVD are marked in each case. The broadest comb span can be achieved around zero-dispersion wavelength of OSBR.

    We also study the effect of dispersion on comb generation in the OSBR. The comb spectra are shown in Fig. 5(c), under different pump wavelengths from 600 to 1200 nm with a fixed detuning of 0 MHz and pump power of 6 W. The corresponding group velocity dispersion (GVD) varies at the central wavelength of the comb as the pump wavelength changes. The dispersion changes results in a change in the comb span, and the broadest comb span can be achieved around the zero-dispersion wavelength of the OSBR.

    5. DISCUSSION AND CONCLUSION

    In conclusion, we develop a new type of mini-OPO called OSBR and utilize it for χ(2) OFC generation at 2 μm. With the large second-order nonlinear coefficient of lithium niobate and near-material-limited high Q, an 80 mW OPO threshold has been achieved. The relatively large cross section of the OSBR results in high output power of 340 mW with a CW NIR pump laser. OFC is generated at around 2 μm with over 40 nm comb span, and detectable repetition frequency of 1.426 GHz is measured. Revival temporal profiles can be captured, and the narrow beat note linewidth of less than 10 Hz reveals a highly coherent comb generation, which founds a good basis for further active stabilization. Experimental results agree well with simulation in both the frequency and time domains, indicating a steady-state comb generation. In this study, we demonstrate an OFC generation at 2 μm, which can be utilized for the sensing of carbon dioxide and water vapor as well as mine prospect applications. It can be adapted to other wavelengths by flexible superlattice structure manipulating. More complex structures like chirped structure can also be applied to the OSBR for octave-spanning OFC generation, and nonlinear dispersion control is possible with proper chirping to manipulate comb dynamics toward soliton comb generation [43,44]. Therefore, our χ(2) LN OSBR introduces extra freedom for the mini-OPO-based OFC generation, and similar geometry can be adapted to other platforms, including lithium niobate on insulator (LNOI) with lower threshold and further integration for low power application. We show the advantage of OSBR for MIR comb generation with an NIR pump and open a door for further studies on these new χ(2) platforms based on their unique dynamics and potential significance in practical applications.

    Acknowledgment

    Acknowledgment. The authors acknowledge Prof. Xiaoshun Jiang, Ming Nie, and Bowen Li for fruitful discussions and suggestions regarding the manuscript.

    References

    [1] J. A. Giordmaine, R. C. Miller. Tunable coherent parametric oscillation in LiNbO3 at optical frequencies. Phys. Rev. Lett., 14, 973-976(1965).

    [2] S. E. Harris. Tunable optical parametric oscillators. Proc. IEEE, 57, 2096-2113(1969).

    [3] S. Brosnan, R. Byer. Optical parametric oscillator threshold and linewidth studies. IEEE J. Quantum Electron., 15, 415-431(1979).

    [4] W. R. Bosenberg, A. Drobshoff, J. I. Alexander, L. E. Myers, R. L. Byer. 93% pump depletion, 3.5  W continuous-wave, singly resonant optical parametric oscillator. Opt. Lett., 21, 1336-1338(1996).

    [5] B. Hardy, A. Berrou, S. Guilbaud, M. Raybaut, A. Godard, M. Lefebvre. Compact, single-frequency, doubly resonant optical parametric oscillator pumped in an achromatic phase-adapted double-pass geometry. Opt. Lett., 36, 678-680(2011).

    [6] B. Scherrer, I. Ribet, A. Godard, E. Rosencher, M. Lefebvre. Dual-cavity doubly resonant optical parametric oscillators: demonstration of pulsed single-mode operation. J. Opt. Soc. Am. B, 17, 1716-1729(2000).

    [7] M. Lazoul, A. Boudrioua, S. L. Simohamed, A. Fischer, L. H. Peng. Experimental study of multiwavelength parametric generation in a two-dimensional periodically poled lithium tantalate crystal. Opt. Lett., 38, 3892-3894(2013).

    [8] M. Lazoul, A. Boudrioua, L.-M. Simohamed, L.-H. Peng. Multi-resonant optical parametric oscillator based on 2D-PPLT nonlinear photonic crystal. Opt. Lett., 40, 1861-1864(2015).

    [9] N. E. Yu, S. Kurimura, Y. Nomura, M. Nakamura, K. Kitamura. Efficient optical parametric oscillation based on periodically poled 1.0  mol% MgO-doped stoichiometric LiTaO3. Appl. Phys. Lett., 85, 5134-5136(2004).

    [10] N. E. Yu, S. Kurimura, Y. Nomura, M. Nakamura, K. Kitamura, J. Sakuma, Y. Otani, A. Shiratori. Periodically poled near-stoichiometric lithium tantalate for optical parametric oscillation. Appl. Phys. Lett., 84, 1662-1664(2004).

    [11] C. R. Phillips, J. S. Pelc, M. M. Fejer. Continuous wave monolithic quasi-phase-matched optical parametric oscillator in periodically poled lithium niobate. Opt. Lett., 36, 2973-2975(2011).

    [12] C. Langrock, M. M. Fejer. Fiber-feedback continuous-wave and synchronously-pumped singly-resonant ring optical parametric oscillators using reverse-proton-exchanged periodically-poled lithium niobate waveguides. Opt. Lett., 32, 2263-2265(2007).

    [13] G. Schreiber, D. Hofmann, W. Grundkotter, Y. L. Lee, H. Suche, V. Quiring, R. Ricken, W. Sohler. Nonlinear integrated optical frequency conversion in periodically poled Ti:LiNbO3 waveguides. Proc. SPIE, 4277, 144-160(2001).

    [14] S.-Y. Tu, A. H. Kung, Z. D. Gao, S. N. Zhu. Efficient periodically poled stoichiometric lithium tantalate optical parametric oscillator for the visible to near-infrared region. Opt. Lett., 30, 2451-2453(2005).

    [15] Z. D. Xie, X. J. Lv, Y. H. Liu, W. Ling, Z. L. Wang, Y. X. Fan, S. N. Zhu. Cavity phase matching via an optical parametric oscillator consisting of a dielectric nonlinear crystal sheet. Phys. Rev. Lett., 106, 083901(2011).

    [16] M. M. J. W. van Herpen, S. T. L. Hekkert, S. E. Bisson, F. J. M. Harren. Wide single-mode tuning of a 3.0–3.8  μm, 700  mW, continuous-wave Nd:YAG-pumped optical parametric oscillator based on periodically poled lithium niobate. Opt. Lett., 27, 640-642(2002).

    [17] P. Gross, M. E. Klein, T. Walde, K. J. Boller, M. Auerbach, P. Wessels, C. Fallnich. Fiber-laser-pumped continuous-wave singly resonant optical parametric oscillator. Opt. Lett., 27, 418-420(2002).

    [18] M. E. Klein, P. Gross, K. J. Boller, M. Auerbach, P. Wessels, C. Fallnich. Rapidly tunable continuous wave optical parametric oscillator pumped by a fiber laser. Opt. Lett., 28, 920-922(2003).

    [19] I. Lindsay, B. Adhimoolam, P. Gross, M. Klein, K.-J. Boller. 110  GHz rapid, continuous tuning from an optical parametric oscillator pumped by a fiber-amplified DBR diode laser. Opt. Express, 13, 1234-1239(2005).

    [20] C. S. Werner, K. Buse, I. Breunig. Continuous-wave whispering gallery optical parametric oscillator for high-resolution spectroscopy. Opt. Lett., 40, 772-775(2015).

    [21] A. W. Bruch, X. Liu, J. B. Surya, C.-L. Zou, H. X. Tang. On-chip χ(2) microring optical parametric oscillator. Optica, 6, 1361-1366(2019).

    [22] J. U. Furst, D. V. Strekalov, D. Elser, A. Aiello, U. L. Andersen, C. Marquardt, G. Leuchs. Low-threshold optical parametric oscillations in a whispering gallery mode resonator. Phys. Rev. Lett., 105, 263904(2010).

    [23] Q. Mo, S. Li, Y. Liu, X. Jiang, G. Zhao, Z. Xie, X. Lv, S. Zhu. Widely tunable optical parametric oscillator in periodically poled congruently grown lithium tantalite whispering gallery mode resonators. Chin. Opt. Lett., 14, 091902(2016).

    [24] S. N. Zhu, Y. Y. Zhu, N. B. Ming. Quasi-phase-matched third-harmonic generation in a quasi-periodic optical superlattice. Science, 278, 843-846(1997).

    [25] Y. W. Lee, F. C. Fan, Y. C. Huang, B. Y. Gu, B. Z. Dong, M. H. Chou. Nonlinear multiwavelength conversion based on an aperiodic optical superlattice in lithium niobate. Opt. Lett., 27, 2191-2193(2002).

    [26] T. Beckmann, H. Linnenbank, H. Steigerwald, B. Sturman, D. Haertle, K. Buse, I. Breunig. Highly tunable low-threshold optical parametric oscillation in radially poled whispering gallery resonators. Phys. Rev. Lett., 106, 143903(2011).

    [27] T. Udem, R. Holzwarth, T. W. Hänsch. Optical frequency metrology. Nature, 416, 233-237(2002).

    [28] S. T. Cundiff, J. Ye. Colloquium: femtosecond optical frequency combs. Rev. Mod. Phys., 75, 325-342(2003).

    [29] P. Del’Haye, A. Schliesser, O. Arcizet, T. Wilken, R. Holzwarth, T. J. Kippenberg. Optical frequency comb generation from a monolithic microresonator. Nature, 450, 1214-1217(2007).

    [30] T. J. Kippenberg, R. Holzwarth, S. A. Diddams. Microresonator-based optical frequency combs. Science, 332, 555-559(2011).

    [31] V. Ulvila, C. Phillips, L. Halonen, M. Vainio. Frequency comb generation by a continuous-wave-pumped optical parametric oscillator based on cascading quadratic nonlinearities. Opt. Lett., 38, 4281-4284(2013).

    [32] V. Ulvila, C. Phillips, L. Halonen, M. Vainio. High-power mid-infrared frequency comb from a continuous-wave-pumped bulk optical parametric oscillator. Opt. Express, 22, 10535-10543(2014).

    [33] A. W. Bruch, X. Liu, Z. Gong, J. B. Surya, M. Li, C. L. Zou, H. X. Tang. Pockels soliton microcomb. Nat. Photonics, 15, 21-27(2021).

    [34] B. M. Notaroš. Conceptual Electromagnetics(2017).

    [35] S. M. Spillance, T. J. Kippenberg, K. J. Vahala. Ultralow-threshold Raman laser using a spherical dielectric microcavity. Nature, 415, 621-623(2002).

    [36] D. K. Armani, T. J. Kippenberg, S. M. Spillane, K. J. Vahala. Ultra-high-Q toroid microcavity on a chip. Nature, 421, 925-928(2003).

    [37] V. S. Ilchenko, A. A. Savchenkov, A. B. Matsko, L. Maleki. Nonlinear optics and crystalline whispering gallery mode cavities. Phys. Rev. Lett., 92, 043903(2004).

    [38] M. Ebrahimzadeh, M. H. Dunn. Optical Parametric Oscillators in Handbook of Optics(2001).

    [39] S. Mosca, M. Parisi, I. Ricciardi, F. Leo, T. Hansson, M. Erkintalo, P. Maddaloni, P. De Natale, S. Wabnitz, M. De Rosa. Modulation instability induced frequency comb generation in a continuously pumped optical parametric oscillator. Phys. Rev. Lett., 121, 093903(2018).

    [40] M. Stefszky, V. Ulvila, Z. Abdallah, C. Silberhorn, M. Vainio. Towards optical-frequency-comb generation in continuous-wave-pumped titanium-indiffused lithium-niobate waveguide resonators. Phys. Rev. A, 98, 053850(2018).

    [41] O. Gayer, Z. Sacks, E. Galun, A. Arie. Temperature and wavelength dependent refractive index equations for MgO-doped congruent and stoichiometric LiNbO3. Appl. Phys. B, 91, 343-348(2008).

    [42] A. V. Smith, R. J. Gehr, M. S. Bowers. Numerical models of broad-bandwidth nanosecond optical parametric oscillators. J. Opt. Soc. Am. B, 16, 609-619(1999).

    [43] T. Hansson, P. Parra-Rivas, M. Bernard, F. Leo, L. Gelens, S. Wabnitz. Quadratic soliton combs in doubly resonant second-harmonic generation. Opt. Lett., 43, 6033-6036(2018).

    [44] M. Nie, S.-W. Huang. Quadratic soliton mode-locked degenerate optical parametric oscillator. Opt. Lett., 45, 2311-2314(2020).

    Xiaohan Wang, Kunpeng Jia, Mengwen Chen, Shanshan Cheng, Xin Ni, Jian Guo, Yihao Li, Huaying Liu, Liyun Hao, Jian Ning, Gang Zhao, Xinjie Lv, Shu-Wei Huang, Zhenda Xie, Shi-Ning Zhu. 2 μm optical frequency comb generation via optical parametric oscillation from a lithium niobate optical superlattice box resonator[J]. Photonics Research, 2022, 10(2): 509
    Download Citation