
Peng WANG, Hong-Yu YAO, Gong ZHANG. A novel interpolation-based subpixel mapping for hyperspectral image by using pansharpening[J]. Journal of Infrared and Millimeter Waves, 2021, 40(1): 56
- Journal of Infrared and Millimeter Waves
- Vol. 40, Issue 1, 56 (2021)
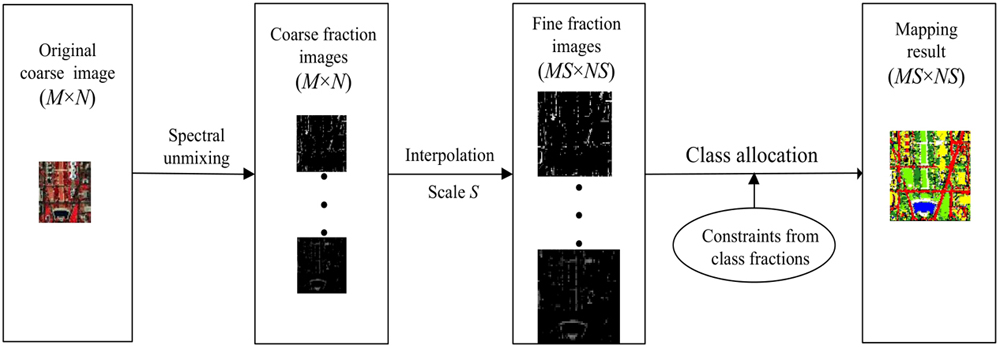
Fig. 1. The flowchart of ISPM
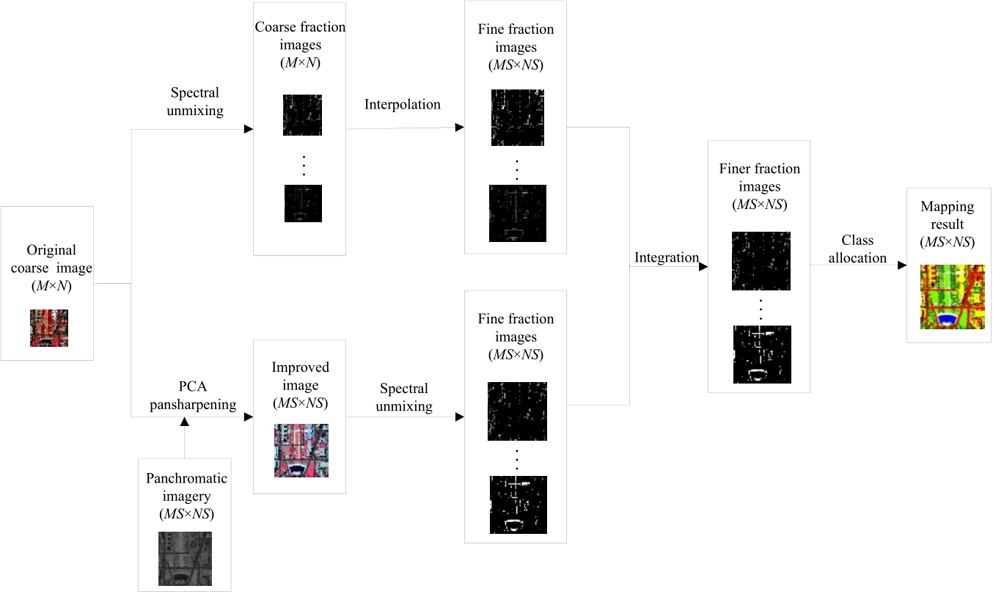
Fig. 2. The flowchart of proposed PAN-ISPM
Fig. 3. (a) False color image of Washington DC (bands 65, 52, and 36 for red, green, and blue, respectively). (b) Coarse image (
Fig. 4. (a) Reference image, (b) BI, (c) BIC, (d) SS-BI, (e) HIPP, (f) PAN-ISPM
Fig. 5. (a) PCC (%) of the five methods in relation to zoom factor
Fig. 6. (a) False color image of Rome (bands 150, 10, and 24 for red, green, and blue, respectively), (b) Panchromatic image, (c) Pansharpening result.
Fig. 7. (a) Reference image, (b) BI, (c) BIC, (d) SS-BI, (e) HIPP, (f) PAN-ISPM
Fig. 8. PCC (%) of the two experiments in relation to weight parameter
Fig. 9. Computing time of the five ISPM methods in the two experiments
Fig. 10. PCC (%) of PAN-ISPM result in relation to BDSD and PCA in the two experiments
|
Table 1. Accuracy evaluation of the five methods.
|
Table 2. Accuracy evaluation of the five methods.

Set citation alerts for the article
Please enter your email address
© Copyright 2018-2021 | Chinese Laser Press. All Rights Reserved 沪ICP备15018463号-20