
Peng WANG, Hong-Yu YAO, Gong ZHANG. A novel interpolation-based subpixel mapping for hyperspectral image by using pansharpening[J]. Journal of Infrared and Millimeter Waves, 2021, 40(1): 56
- Journal of Infrared and Millimeter Waves
- Vol. 40, Issue 1, 56 (2021)
Abstract
Introduction
Due to limitation of hardware and complexity of environment,hyperspectral image always contains lots of mixed pixels,resulting in the inaccurate land cover class mapping information[
There are two main SPM types:initialization then optimization type and soft then hard type[
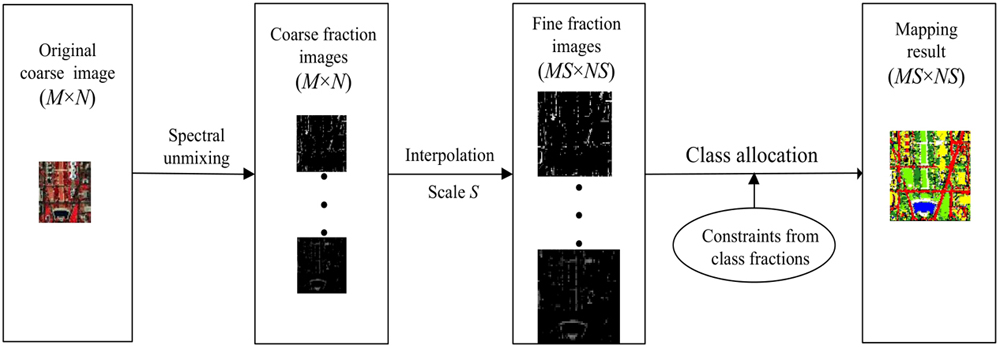
In addition,the interpolation-based subpixel mapping(ISPM)has been an important method of soft then hard type due to its simple physical meaning. The existing ISPM method basically contains two processing steps[
In this paper,using pansharpening technique improves interpolation-based subpixel mapping(PAN-ISPM)is proposed. The original coarse remote sensing image is first fused with the high resolution panchromatic image from the same area by pansharpening technique[
1 Method
1.1 ISPM model
Suppose
As shown in
where
![]()
Figure 1.The flowchart of ISPM
Finally,class allocation method is utilized to allocate the class labels to all subpixels according to the predicted values.
1.2 PAN-ISPM model
As shown in
![]()
Figure 2.The flowchart of proposed PAN-ISPM
Firstly,the resolution of the original image is improved by pansharpening technique in a novel processing path. The main purpose of this paper is to improve the existing ISPM model by the new processing path. Pansharpening technique is just a tool to get new processing path. Therefore,we only consider the role of the new processing path. Due to effectively rendering spatial details and fast implementation,principal component analysis(PCA)is selected as the pansharpening method here. Other more effective pansharpening methods can also be used in the new path,but it is beyond the scope of this article. The novel fine fraction images with predicted values
Secondly,the finer fraction images with the predicted values
The formula of integrating is given as:
Finally,class allocation method is utilized to obtain the mapping result according to the predicted values
Since the resolution of the original coarse image is improved by pansharpening technique,the more spatial-spectral information is supplied to improve the final mapping result.
2 Experiment
Five ISPM methods are tested and compared:bilinear interpolation(BI)[
2.1 Simulated Data
The original fine remote sensing image is downsampled by
To avoid the effect of errors caused by the acquisition of the panchromatic image,only considering the effect of pansharpening technique,the spectral response of the IKONOS satellite is utilized in the original remote sensing image to create appropriate synthetic panchromatic image [
![]()
Figure 3.(a) False color image of Washington DC (bands 65, 52, and 36 for red, green, and blue, respectively). (b) Coarse image (
As shown in
![]()
Figure 4.(a) Reference image, (b) BI, (c) BIC, (d) SS-BI, (e) HIPP, (f) PAN-ISPM
Five ISPM methods are quantitatively evaluated by the classification accuracy of each class,PCC and Kappa. Checking the
| Class | BI | BIC | SS-BI | HIPP | PAN-ISPM |
|---|---|---|---|---|---|
| Shadow | 73.44% | 75.03% | 81.62% | 82.83% | 86.28% |
| Water | 85.56% | 88.97% | 94.45% | 94.73% | 95.03% |
| Road | 70.55% | 72.74% | 76.29% | 79.10% | 81.16% |
| Tree | 72.45% | 75.45% | 76.61% | 78.64% | 79.14% |
| Grass | 74.70% | 78.60% | 82.74% | 83.93% | 86.60% |
| Roof | 70.67% | 72.98% | 77.18% | 78.56% | 80.02% |
| Trail | 73.88% | 75.58% | 79.08% | 82.53% | 84.01% |
| PCC | 76.82% | 77.47% | 80.72% | 81.54% | 87.18% |
| Kappa | 0.7356 | 0.7429 | 0.7772 | 0.8055 | 0.8426 |
Table 1. Accuracy evaluation of the five methods.
To evaluate the effect of the zoom factor
![]()
Figure 5.(a) PCC (%) of the five methods in relation to zoom factor
2.2 Real data
To better demonstrate the effectiveness of the proposed PAN-ISPM,a real data set is used in experiment 2. A 30-m hyperspectral image is captured by the Hyperion satellite over Rome,Italy. As shown in
![]()
Figure 6.(a) False color image of Rome (bands 150, 10, and 24 for red, green, and blue, respectively), (b) Panchromatic image, (c) Pansharpening result.
As shown in
| Class | BI | BIC | SS-BI | HIPP | PAN-ISPM |
|---|---|---|---|---|---|
| Vegetation | 60.08% | 61.96% | 66.56% | 74.50% | 75.93% |
| Soil | 60.22% | 61.43% | 64.93% | 65.80% | 71.78% |
| Built-up | 81.32% | 82.42% | 83.97% | 84.99% | 87.09% |
| Water | 37.18% | 44.10% | 49.49% | 54.36% | 61.03% |
| PCC | 70.62% | 72.06% | 74.89% | 77.55% | 80.03% |
| Kappa | 0.587 7 | 0.598 5 | 0.616 4 | 0.639 9 | 0.673 6 |
Table 2. Accuracy evaluation of the five methods.
![]()
Figure 7.(a) Reference image, (b) BI, (c) BIC, (d) SS-BI, (e) HIPP, (f) PAN-ISPM
2.3 Discussion
First,the weight parameter
![]()
Figure 8.PCC (%) of the two experiments in relation to weight parameter
Second,the computing time is an important index to estimate the performance of ISPM methods. The computing time of five ISPM methods in experiment 1 and 2 is shown in
![]()
Figure 9.Computing time of the five ISPM methods in the two experiments
Finally,the performance of PAN-ISPM depends on pansharpening technique. Therefore,it is necessary to test the effects of different pansharpening methods on the performance of the proposed method. The band-dependent spatial detail(BDSD)[
![]()
Figure 10.PCC (%) of PAN-ISPM result in relation to BDSD and PCA in the two experiments
3 Conclusion
In this paper,the PAN-ISPM is proposed to improve the mapping result. First of all,the original coarse hyperspectral image is utilized to obtain the improved image by pansharpening in the novel processing path,and the improved image is unmixed to produce the novel fine fraction images. The finer fraction images with more spatial-spectral information e then obtained by integrating the novel fine fraction images from the novel path and the existing fine fraction images from the existing path. Finally,the final mapping result is derived by class allocation method according to the predicted values from the finer fraction images. Because the coarse resolution of the original image is improved by pansharpening in the novel processing path,the more spatial-spectral information of the original image could be fully supplied to ISPM,and the final mapping result is improved. The visual and quantitative comparison with the existing ISPM methods shows the result of the PAN-ISPM is better.
The appropriate parameter
References
[1] Feng LING, Shen-Jun WU, Fei XIAO et al. Sub-pixel mapping of remotely sensed imagery: a review. Journal of Image and Graphics, 16, 1335-1345(2011).
[2] F Ling, G M Foody. Super-resolution land cover mapping by deep learning. Remote Sensing Letters, 10, 598-606(2019).
[3] Q Wang, C Zhang, P M Atkinson. Sub-pixel mapping with point constraints. Remote Sensing of Environment, 224, 111817(2020).
[4] Q M Wang, W Shi, L Wang. Allocating classes for soft-then-hard sub-pixel mapping algorithms in units of class. IEEE Transactions on Geoscience and Remote Sensing, 52, 2940-2959(2014).
[5] P M Atkinson. Sub-pixel target mapping from soft-classified remotely sensed imagery. Photogrammetric Engineering and Remote Sensing, 71, 839-846(2005).
[6] A Villa, J Chanussot, J A Benediktsson et al. Spectral unmixing for the classification of hyperspectral images at a finer spatial resolution. IEEE Journal of Selected Topics in Signal Processing, 5, 521-533(2011).
[7] F Ling, W Li, Y Du et al. Land cover change mapping at the subpixel scale with different spatial-resolution remotely sensed imagery. IEEE Geoscience and Remote Sensing Letters, 8, 182-186(2011).
[8] Y Makido, A Shortridge, J P Messina. Assessing alternatives for modeling the spatial distribution of multiple land-cover classes at subpixel scales. Photogrammetric Engineering and Remote Sensing, 73, 935-943(2007).
[9] D He, Y Zhong, R Feng et al. Spatial-temporal sub-pixel mapping based on swarm intelligence theory. Remote Sensing, 894(2016).
[10] X Tong, X Xu, A Plaza. A new genetic method for subpixel mapping using hyperspectral images. IEEE Journal of Selected Topics in Applied Earth Observations and Remote Sensing, 9, 4480-4491(2016).
[11] D Nigussie, R Zurita-Milla, J G P W Clevers. Possibilities and limitations of artificial neural networks for subpixel mapping of land cover. International Journal of Remote Sensing, 32, 7203-7226(2011).
[12] Xiong XU, Yan-Fei ZHONG, Liang-Pei ZHANG et al. A sub-pixel mapping algorithm based on BP neural network with spatial autocorrelation function for remote sensing imagery. Acta Geodaetica et Cartographica Sinica, 40, 307-311(2011).
[13] F Ling, X Li, Y Du et al. Sub-pixel mapping of remotely sensed imagery with hybrid intra- and inter-pixel dependence. International Journal of Remote Sensing, 34, 341-357(2013).
[14] P Wang, L Wang. Soft-then-hard super-resolution mapping based on a spatial attraction model with multiscale sub-pixel shifted images. International Journal of Remote Sensing, 38, 4303-4326(2017).
[15] L Lu, Y Hang, L Di. A new spatial attraction model for improving subpixel land cover classification. Remote Sensing, 360(2017).
[17] H Jin, G Mountrakis, P Li. A super-resolution mapping method using local indicator variograms. International Journal of Remote Sensing, 33, 7747-7773(2012).
[18] Q Wang, P M Atkinson, W Shi. Indicator cokriging-based subpixel mapping without prior spatial structure information. IEEE Transactions on Geoscience and Remote Sensing, 53, 309-323(2015).
[19] X Li, Y Du, F Ling et al. Superresolution mapping of remotely sensed image based on hopfield neural network with anisotropic spatial dependence model. IEEE Geoscience and Remote Sensing Letters, 11, 1265-1269(2014).
[20] P Wang, L Wang, H Leung et al. Subpixel mapping based on hopfield neural network with more prior information. IEEE Geoscience and Remote Sensing Letters, 16, 1284-1288(2019).
[21] P Wang, L Wang, J Chanussot. Soft-then-hard subpixel land cover mapping based on spatial-spectral interpolation. IEEE Geoscience and Remote Sensing Letters, 13, 1851-1854(2016).
[22] L Wang, Z Wang, Z Dou et al. Edge-directed interpolation-based sub-pixel mapping. Remote Sensing Letters, 12, 1195-1203(2013).
[23] W Wang Q and Shi. Utilizing multiple subpixel shifted images in subpixel mapping with image interpolation. IEEE Geoscience and Remote Sensing Letters, 11, 798-802(2014).
[24] P Wang, L Wang, M D Mura et al. Using multiple subpixel shifted images with spatial-spectral information in soft-then-hard subpixel mapping. IEEE Journal of Selected Topics in Applied Earth Observations and Remote Sensing, 10, 2950-2959(2017).
[25] Q Wang, W Shi, P M Atkinson. Sub-pixel mapping of remote sensing images based on radial basis function interpolation. ISPRS Journal of Photogrammetry and Remote Sensing, 92, 1-15(2014).
[26] Y. Chen, Y. Ge, D. Song. Superresolution land-cover mapping based on high-accuracy surface modeling. IEEE Transactions on Geoscience and Remote Sensing, 12, 2516-2520(2015).
[27] P Wang, G Zhang, Y Kong et al. Superresolution mapping based on hybrid interpolation by parallel paths. Remote Sensing Letters, 10, 149-157.
[28] G Vivone, L Alparone, J Chanussot et al. A critical comparison among pansharpening algorithms. IEEE Transactions on Geoscience and Remote Sensing, 53, 2565-2585(2015).
[29] J. Verhoeye, R. De Wulf. Land-cover mapping at sub-pixel scales using linear optimization techniques. Remote Sensing of Environment, 79, 96-104(2002).
[30] T. M. Tu, P. S. Huang, C. L. Hung, C. P. Chang. A fast intensity-hue-saturation fusion technique with spectral adjustment for IKONOS imagery. IEEE Geoscience and Remote Sensing Letters, 1, 309-312(2004).
[31] A Garzelli, F Nencini, L Capobianco. Optimal MMSE pan sharpening of very high resolution multispectral images. IEEE Transactions on Geoscience and Remote Sensing, 46, 228-236(2008).

Set citation alerts for the article
Please enter your email address
© Copyright 2018-2021 | Chinese Laser Press. All Rights Reserved 沪ICP备15018463号-20