
Xizheng Ke, Ke Yang, Ying Zhang. Experimental Study onWavefront Distortion Detection Using CAPIS Technology[J]. Laser & Optoelectronics Progress, 2019, 56(12): 120101
- Laser & Optoelectronics Progress
- Vol. 56, Issue 12, 120101 (2019)
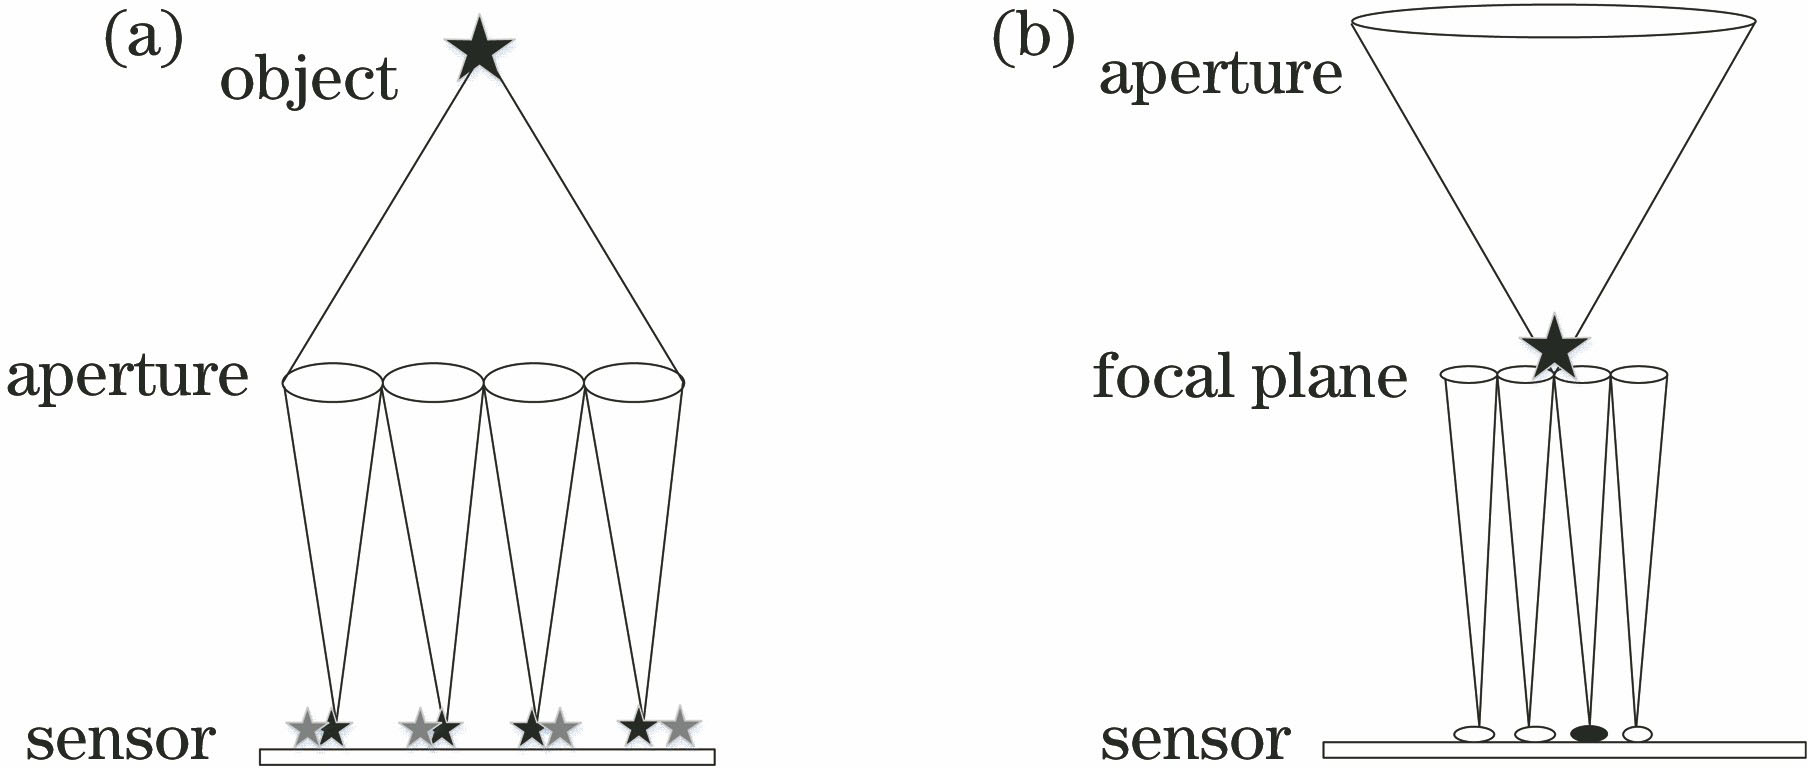
Fig. 1. Structural diagram of wavefront sensor. (a) Hartmann wavefront sensor; (b) structure of CAPIS
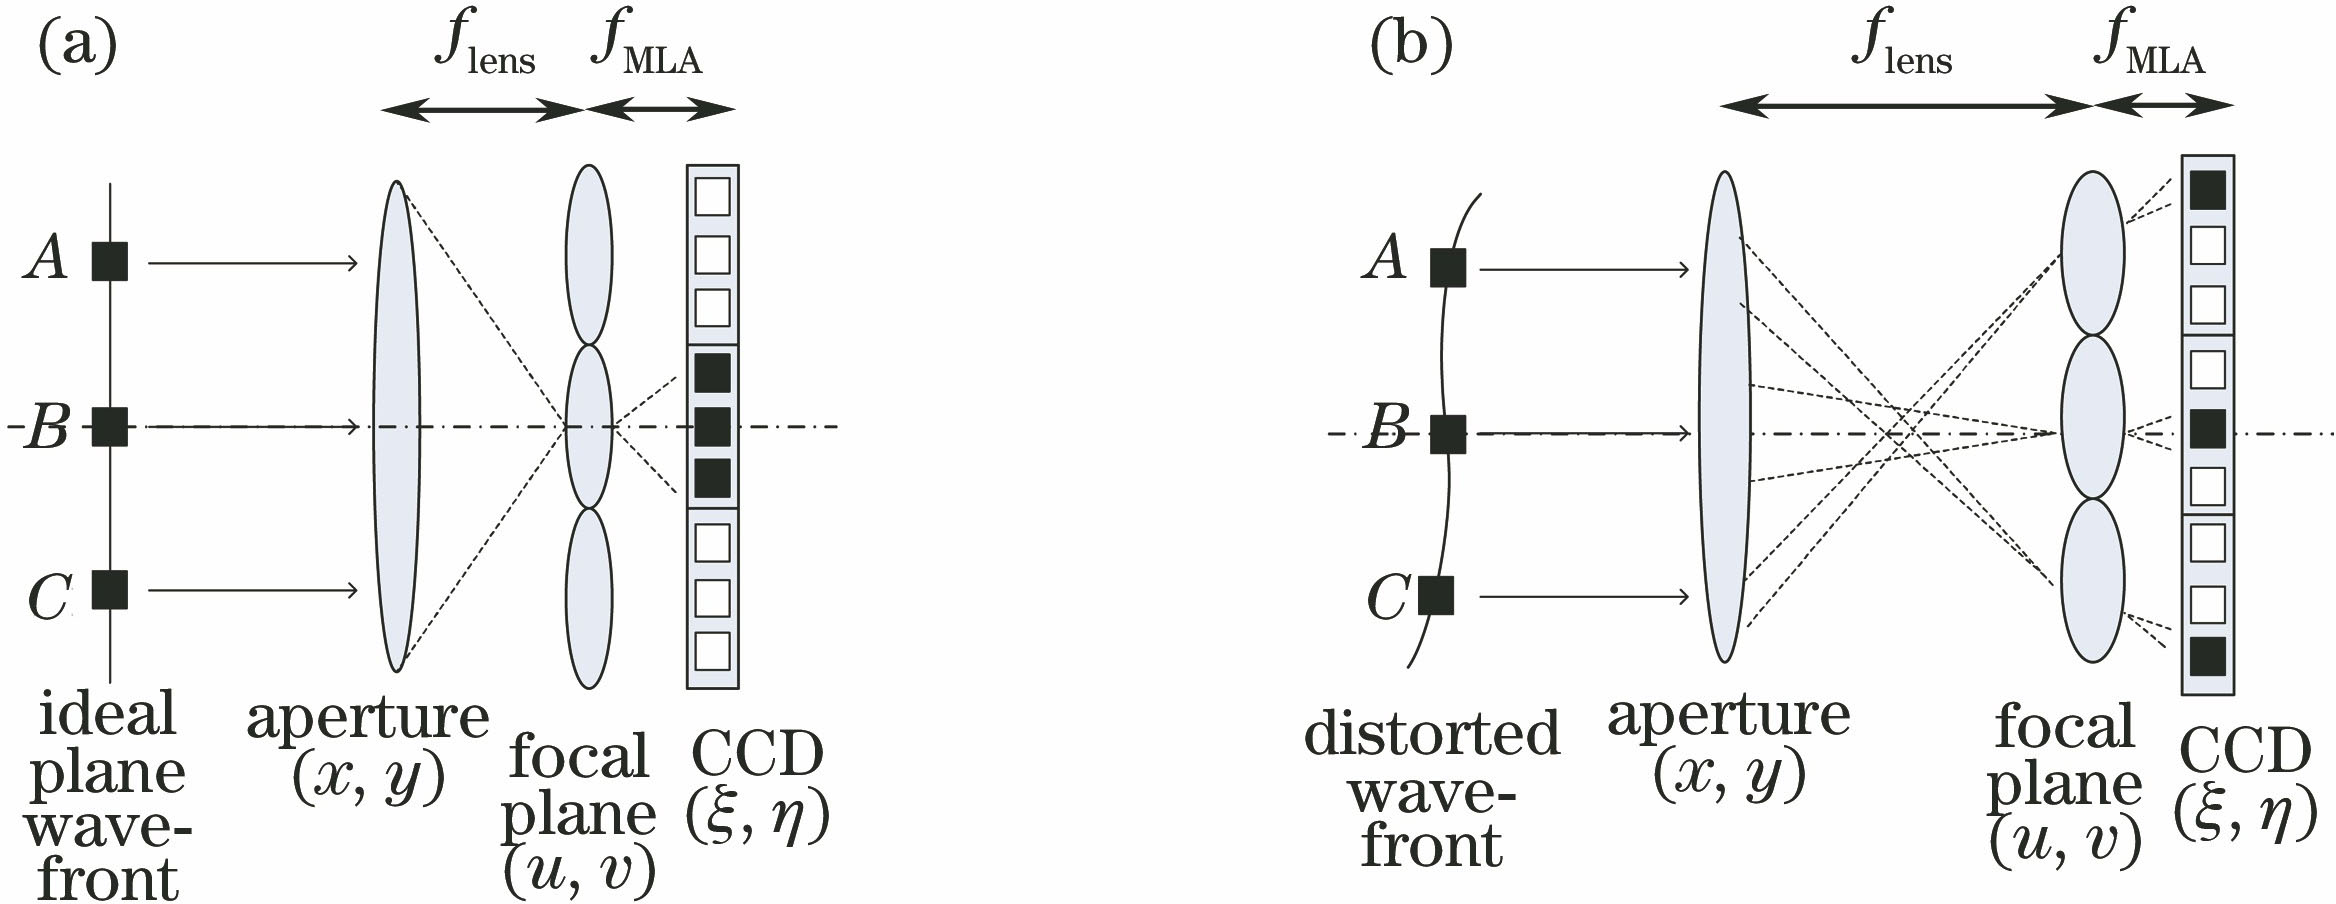
Fig. 2. Principle diagram of wavefront detection using CAPIS structure. (a) Ideal plane wavefront ;(b)distorted wavefront
Fig. 3. Reconstructed results of aberration. (a)(b)(c) Astigmatism; (d)(e)(f) coma; (g)(h)(i) three-leaf
Fig. 4. Reconstructed results of combined aberration. (a)(b)(c) First 10 Zernike polynomial combination; (d)(e)(f) first 15 Zernike polynomial combination
Fig. 5. Diagram of experimental setup
Fig. 6. Reconstructed results of astigmatic aberration. (a) Light spot array on detector; (b) astigmatic aberration distribution to be measured; (c) reconstructed aberration distribution; (d) residual distribution
Fig. 7. Reconstructed results of coma aberration. (a) Light spot array on detector; (b) coma aberration distribution to be measured; (c) reconstructed aberration distribution; (d) residual distribution
Fig. 8. Reconstructed results of three-leaf aberration. (a) Light spot array on detector; (b) three-leaf aberration distribution to be measured; (c) reconstructed aberration distribution; (d) residual distribution
Fig. 9. Reconstructed results of first 10 Zernike combination aberration. (a) Light spot array on detector; (b) combined aberration distribution to be measured; (c) reconstructed aberration distribution; (d) residual distribution
Fig. 10. Reconstructed results of first 15 Zernike combination aberration. (a) Light spot array on detector; (b) combined aberration distribution to be measured; (c) reconstructed aberration distribution; (d) residual distribution
Fig. 11. RMS values of detection results Zernike aberrations. (a) Single-order Zernike aberration; (b) combination aberration

Set citation alerts for the article
Please enter your email address
© Copyright 2018-2021 | Chinese Laser Press. All Rights Reserved 沪ICP备15018463号-20