
Zexiao Xie, Weijing Shao, Xiang Gao, Hanlei Gong, Haoyue Wang, Yuqing Jiao. Underwater Multiple Line-Structured Light Binocular Measuring Method Based on Discrete Epipolar Curve Model[J]. Chinese Journal of Lasers, 2021, 48(13): 1304003
- Chinese Journal of Lasers
- Vol. 48, Issue 13, 1304003 (2021)
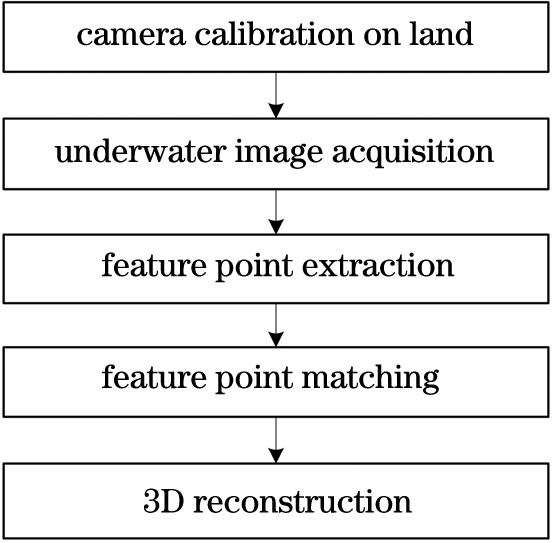
Fig. 1. Flow chart of the underwater measurement system
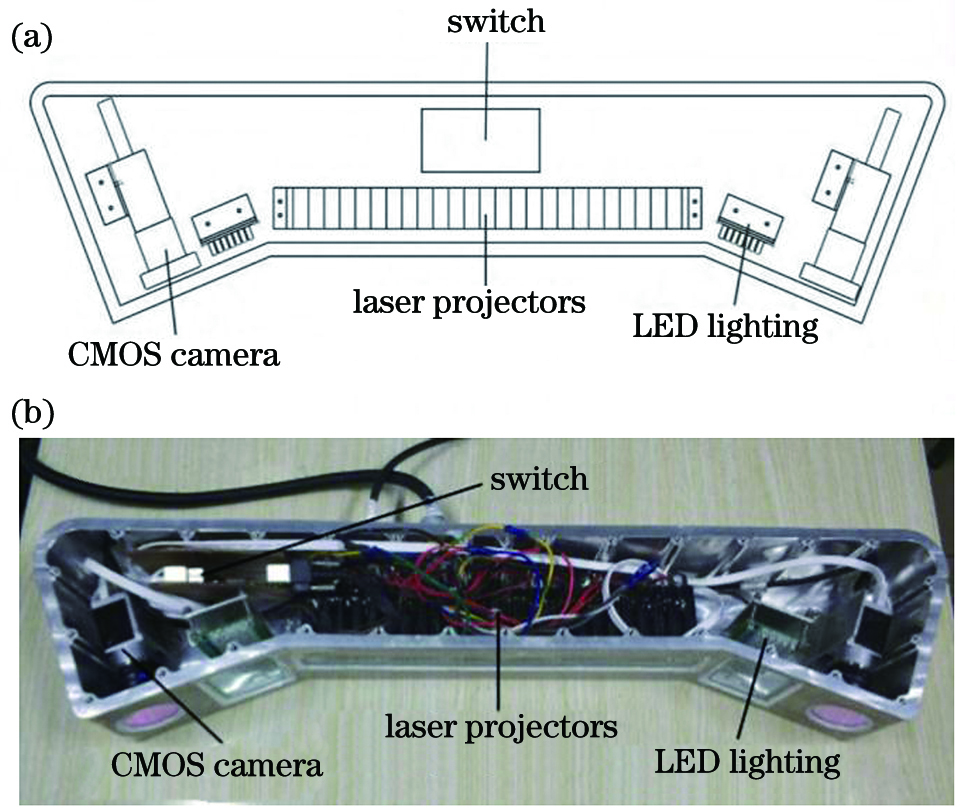
Fig. 2. Principle of the binocular measurement system. (a) Internal structure of the system; (b) internal physical map
Fig. 3. Sealing condition of the equipment
Fig. 4. Underwater standard ball picture taken by the system
Fig. 5. Schematic diagram of the binocular vision model
Fig. 6. Schematic diagram of the line-structured light system
Fig. 7. Model of the underwater epipolar line dispersion curve
Fig. 8. Principle of the feature point matching method
Fig. 9. Target in the experiment. (a) Standard cylinder; (b) standard ball
Fig. 10. Actual situation of the static water environment. (a) Standard cylinder; (b) standard ball
Fig. 11. Processing result of the original image. (a) Original image; (b) region of interest; (c) feature information of structured light in the region of interest; (d) feature points extracted by our method
Fig. 12. Measurement results of underwater epipolar line matching method. (a) Standard cylinder; (b) standard ball
Fig. 13. Standard sphere model
|
Table 1. Matching accuracies of feature points by different methods unit: mm
| |||||||||||||||||||||||
Table 2. 3D reconstruction results of different methods unit: mm
| ||||||||||||||||||||||||||||||||||||||||||||
Table 3. Standard sphere radius measurement results of different methods unit: mm
| ||||||||||||||||||||||||||||||||||
Table 4. Measurement results of standard sphere center distance by different methods unit: mm


Set citation alerts for the article
Please enter your email address

© Copyright 2018-2021 | Chinese Laser Press. All Rights Reserved 沪ICP备15018463号-20