• Spectroscopy and Spectral Analysis
  • Vol. 42, Issue 1, 322 (2022)
Qing YU1、1;, Xiao-li CHEN2、*, Qi-long ZHANG1、1; 3; *;, Hua LIU3、3;, Xian-jiong YANG3、3;, Hong XU3、3;, Ya-li HUANG3、3; *;, Xing FENG4、4; *;, Carl REDSHAW5、5;, and [in Chinese]5、5;
Author Affiliations
  • 11. School of Public Health, the Key Laboratory of Environmental Pollution Monitoring and Disease Control, Ministry of Education, Guizhou Medical University, Guiyang 550004, China
  • 22. School of Clinical Medicine, Guizhou Medical University, Guiyang 550004, China
  • 33. School of Basic Medical Science, Guizhou Medical University, Guiyang 550004, China
  • 44. Guangdong Provincial Key Laboratory of Functional Soft Condensed Matter, School of Material and Energy, Guangdong University of Technology, Guangzhou 510006, China
  • 55. Department of Chemistry & Biochemistry, University of Hull, Cottingham Road, Hull, Yorkshire HU6 7RX, UK
  • show less
    DOI: 10.3964/j.issn.1000-0593(2022)01-0322-11 Cite this Article
    Qing YU, Xiao-li CHEN, Qi-long ZHANG, Hua LIU, Xian-jiong YANG, Hong XU, Ya-li HUANG, Xing FENG, Carl REDSHAW, [in Chinese]. A Highly Selective Colorimetric Naked-Eye Probe for Hypochlorite Detection in Water[J]. Spectroscopy and Spectral Analysis, 2022, 42(1): 322 Copy Citation Text show less
    1H NMR spectrum of PAH (400 MHz, d6-DMSO)
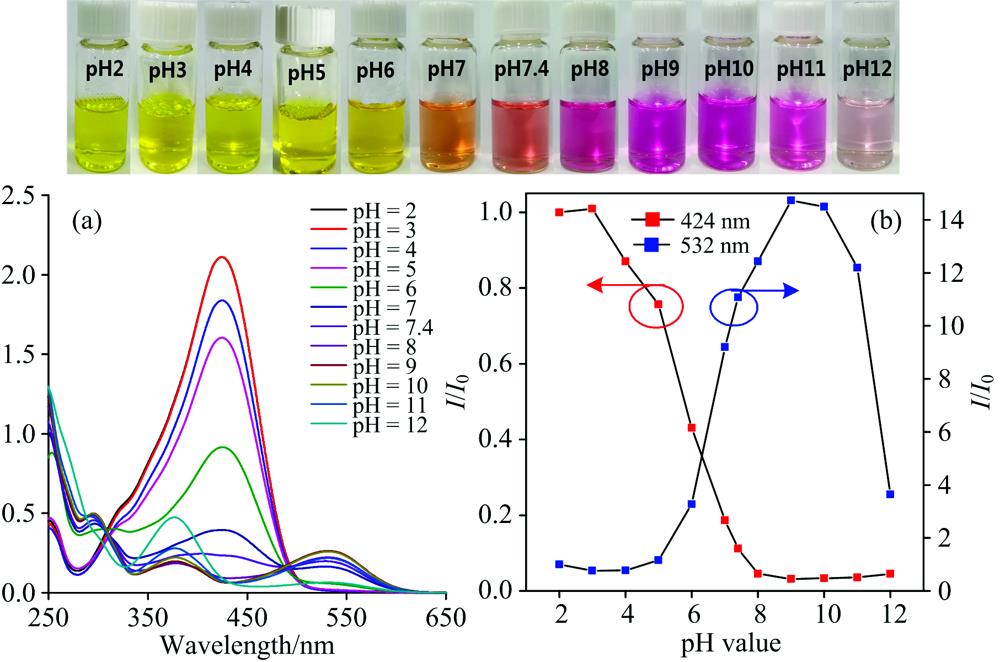
    Fig. 1. 1H NMR spectrum of PAH (400 MHz, d6-DMSO)
    The change of UV-Vis spectra (a) and line graph (b) of probe PAH (0.1 mmol·L-1) in the range from pH 2.0~12.0 using PBS as buffer solution; The color change of photography of probe PAH with the pH value increases under natural light (inset)
    Fig. 1. The change of UV-Vis spectra (a) and line graph (b) of probe PAH (0.1 mmol·L-1) in the range from pH 2.0~12.0 using PBS as buffer solution; The color change of photography of probe PAH with the pH value increases under natural light (inset)
    The synthetic route to probe PAH
    Fig. 1. The synthetic route to probe PAH
    13C NMR spectrum of PAH (d6-DMSO)
    Fig. 2. 13C NMR spectrum of PAH (d6-DMSO)
    Absorption intensity (a—c) at 424 nm of probe PAH (0.1 mmol·L-1) with addition of different species (0.4 mmol·L-1) in the absence/presence of ClO- (0.4 mmol·L-1) in PBS solution (0.01 mol·L-1, pH 5.0), Error bar=RSD (n=3); Visible color (d—f) of probe PAH toward ClO- (0.4 mmol·L-1) in different species under sunlight
    Fig. 2. Absorption intensity (a—c) at 424 nm of probe PAH (0.1 mmol·L-1) with addition of different species (0.4 mmol·L-1) in the absence/presence of ClO- (0.4 mmol·L-1) in PBS solution (0.01 mol·L-1, pH 5.0), Error bar=RSD (n=3); Visible color (d—f) of probe PAH toward ClO- (0.4 mmol·L-1) in different species under sunlight
    The proposed recognition mechanism of probe PAH toward ClO-
    Fig. 2. The proposed recognition mechanism of probe PAH toward ClO-
    UV-Vis absorption spectra (b) of PAH (0.1 mmol·L-1) in the presence of I- toward various concentration of ClO- in PBS buffer solution (0.01 mol·L-1, pH 5.0); The change of visible color (a) of probe PAH toward ClO- under sunlight
    Fig. 3. UV-Vis absorption spectra (b) of PAH (0.1 mmol·L-1) in the presence of I- toward various concentration of ClO- in PBS buffer solution (0.01 mol·L-1, pH 5.0); The change of visible color (a) of probe PAH toward ClO- under sunlight
    UV-Vis spectra of PAH (0.1 mmol·L-1) with addition of nitrate salts of Li+, Co2+, Cr3+, K+, Cd2+, Pb2+, Ca2+, Hg2+, Ba2+, Cu2+, Mg2+, Ni2+, Zn2+, Al3+ and Fe3+(0.4 mmol·L-1), sodium salts of NO2-, I-, AcO-, ClO4-, SO42-, CN-, Br-, CO32- and F- (0.4 mmol·L-1), ClO- (0.4 mmol·L-1), GSH, Vc and ROS/RNS of ONOO-, ROO·, ·OH, H2O2, ·O2-,tBuOOH, tBuO·, 1O2 and NO· (0.4 mmol·L-1) in PBS solution (0.01 mol·L-1, pH 5)
    Fig. 3. UV-Vis spectra of PAH (0.1 mmol·L-1) with addition of nitrate salts of Li+, Co2+, Cr3+, K+, Cd2+, Pb2+, Ca2+, Hg2+, Ba2+, Cu2+, Mg2+, Ni2+, Zn2+, Al3+ and Fe3+(0.4 mmol·L-1), sodium salts of NO2-, I-, AcO-, ClO4-, SO42-, CN-, Br-, CO32- and F- (0.4 mmol·L-1), ClO- (0.4 mmol·L-1), GSH, Vc and ROS/RNS of ONOO-, ROO·, ·OH, H2O2, ·O2-,tBuOOH, tBuO·, 1O2 and NO· (0.4 mmol·L-1) in PBS solution (0.01 mol·L-1, pH 5)
    UV-Vis absorption spectra (a—d) of PAH (0.1 mmol·L-1) with the addition of NO2-, GSH, Vc, ONOO- toward various concentration of ClO- in PBS buffer solution (0.01 mol·L-1, pH 5.0); The change of visible color of probe PAH toward ClO- under sunlight (inset)
    Fig. 4. UV-Vis absorption spectra (a—d) of PAH (0.1 mmol·L-1) with the addition of NO2-, GSH, Vc, ONOO- toward various concentration of ClO- in PBS buffer solution (0.01 mol·L-1, pH 5.0); The change of visible color of probe PAH toward ClO- under sunlight (inset)
    UV-Vis spectra (a) of probe PAH (0.1 mmol·L-1), changing of the absorption intensity (b) at 424 nm of probe PAH upon addition of increasing concentrations (0~1.4 mmol·L-1) of ClO- in PBS (0.01 mol·L-1, pH 5.0) and linearity of absorption intensity (c) of probe PAH with the addition of ClO- from 0~0.28 mmol·L-1. Error bar=RSD (n=3)
    Fig. 4. UV-Vis spectra (a) of probe PAH (0.1 mmol·L-1), changing of the absorption intensity (b) at 424 nm of probe PAH upon addition of increasing concentrations (0~1.4 mmol·L-1) of ClO- in PBS (0.01 mol·L-1, pH 5.0) and linearity of absorption intensity (c) of probe PAH with the addition of ClO- from 0~0.28 mmol·L-1. Error bar=RSD (n=3)
    UV-Vis absorption spectra of indolinium in the absence/presence of ClO- in aqueous solution and UV-Vis absorption spectra of probe PAH (0.1 mmol·L-1) in the presence of ClO- (0.12 mmol·L-1 or 0.4 mmol·L-1) in PBS (0.01 mol·L-1, pH 5.0); Photography of indolinium in the absence/presence of ClO- (inset)
    Fig. 5. UV-Vis absorption spectra of indolinium in the absence/presence of ClO- in aqueous solution and UV-Vis absorption spectra of probe PAH (0.1 mmol·L-1) in the presence of ClO- (0.12 mmol·L-1 or 0.4 mmol·L-1) in PBS (0.01 mol·L-1, pH 5.0); Photography of indolinium in the absence/presence of ClO- (inset)
    UV-Vis spectra of probe PAH (0.1 mmol·L-1) with the addition of ClO- (0~1.4 mmol·L-1) in PBS (0.01 mol·L-1) in pH 2.0 (a), pH 7.4 (b), respectively; The photography change of visible color of probe PAH toward ClO- under sunlight (inset)
    Fig. 5. UV-Vis spectra of probe PAH (0.1 mmol·L-1) with the addition of ClO- (0~1.4 mmol·L-1) in PBS (0.01 mol·L-1) in pH 2.0 (a), pH 7.4 (b), respectively; The photography change of visible color of probe PAH toward ClO- under sunlight (inset)
    UV-Vis spectra of probe PAH (0.1 mmol·L-1) with the addition of ClO- (0~1.4 mmol·L-1) in PBS (0.01 mol·L-1) in pH 3.0 (a), pH 4.0 (b), pH 5.0 (c), pH 6.0 (d), pH 7.0 (e), pH 8.0 (f), pH 9.0 (g), pH 10.0 (h), pH 11.0 (i), pH 12.0 (j), respectively; The photography change of visible color of probe PAH toward ClO- under sunlight (inset)
    Fig. 6. UV-Vis spectra of probe PAH (0.1 mmol·L-1) with the addition of ClO- (0~1.4 mmol·L-1) in PBS (0.01 mol·L-1) in pH 3.0 (a), pH 4.0 (b), pH 5.0 (c), pH 6.0 (d), pH 7.0 (e), pH 8.0 (f), pH 9.0 (g), pH 10.0 (h), pH 11.0 (i), pH 12.0 (j), respectively; The photography change of visible color of probe PAH toward ClO- under sunlight (inset)
    Comparison of the interaction time between PAH (0.1 mmol·L-1) and ClO- (0.8 mmol·L-1) in aqueous solution of PBS (0.01 mol·L-1, pH 2.0~12.0)
    Fig. 7. Comparison of the interaction time between PAH (0.1 mmol·L-1) and ClO- (0.8 mmol·L-1) in aqueous solution of PBS (0.01 mol·L-1, pH 2.0~12.0)
    HRMS of intermediate 1The peak (m/z) at 160.111 89 corresponds to [M+H]+ ion (Calcd: 159.10)
    Fig. 8. HRMS of intermediate 1
    The peak (m/z) at 160.111 89 corresponds to [M+H]+ ion (Calcd: 159.10)
    HRMS of 2-hydroxybenzoic acidThe peak (m/z) at 139.038 97 corresponds to [M+H]+ ion (Calcd: 138.03)
    Fig. 9. HRMS of 2-hydroxybenzoic acid
    The peak (m/z) at 139.038 97 corresponds to [M+H]+ ion (Calcd: 138.03)
    HRMS of intermediate 2The peak (m/z) at 282.115 84 corresponds to [M+H]+ ion (Calcd: 281.11)
    Fig. 10. HRMS of intermediate 2
    The peak (m/z) at 282.115 84 corresponds to [M+H]+ ion (Calcd: 281.11)
    Sample nameAdded ClO-
    /(μmol·L-1)
    Found ClO-
    /(μmol·L-1)b
    Determined ClO-
    /(μmol L-1)
    Recovery
    /%
    40.00a54.44±1.3698.35
    84 disinfectant60.0077.24±0.32151±6.68103.57
    80.0096.98±3.01102.35
    Tap water0.007.96±1.27.96
    40.0043.75±1.7689.48
    60.0064.28±2.4793.87
    80.0087.42±2.8699.33
    Table 1. Determination of ClO- concentrations in real samples
    Qing YU, Xiao-li CHEN, Qi-long ZHANG, Hua LIU, Xian-jiong YANG, Hong XU, Ya-li HUANG, Xing FENG, Carl REDSHAW, [in Chinese]. A Highly Selective Colorimetric Naked-Eye Probe for Hypochlorite Detection in Water[J]. Spectroscopy and Spectral Analysis, 2022, 42(1): 322
    Download Citation