
Qing YU, Xiao-li CHEN, Qi-long ZHANG, Hua LIU, Xian-jiong YANG, Hong XU, Ya-li HUANG, Xing FENG, Carl REDSHAW, [in Chinese]. A Highly Selective Colorimetric Naked-Eye Probe for Hypochlorite Detection in Water[J]. Spectroscopy and Spectral Analysis, 2022, 42(1): 322
- Spectroscopy and Spectral Analysis
- Vol. 42, Issue 1, 322 (2022)
Abstract
Introduction
Hypochlorous acid (HClO) or hypochlorite (ClO-), as typical reactive oxygen species (ROS), play several fundamental roles in the human body and are biologically produced by the reaction of chloride ions (Cl-) and hydrogen peroxide (H2O2) via catalysis of myeloperoxidase (MPO) in the immune cell[
Hypochlorite is ubiquiuous in daily human life and appears in many applications, such as the sanitization of tap water and swimming pools. Traditional methods for the detection of ClO- include iodine reduction titration, electrochemical methods[
In this paper, for portable purposes, a simple-to-use and naked-eye diagnostic tool were explored for ClO- detection in an aqueous solution with the advantage of a rapid response, high sensitivity and a low detect limitation. Herein, we present an example of a colorimetric “naked-eye” probe photoacid (PAH) for ClO- detection with high selectivity in aqueous solution, which was designed and synthesized via a Knoevenagel reaction between indolinium and salicylic aldehyde in good yield[
![]()
Figure 1.1H NMR spectrum of PAH (400 MHz, d6-DMSO)
![]()
Figure 2.13C NMR spectrum of PAH (d6-DMSO)
![]()
Figure 3.UV-Vis absorption spectra (b) of PAH (0.1 mmol·L-1) in the presence of I- toward various concentration of ClO- in PBS buffer solution (0.01 mol·L-1, pH 5.0); The change of visible color (a) of probe PAH toward ClO- under sunlight
1 Experimental
1.1 Materials and instruments
All reagents and solvents were of analytical grade and were used without further purification. Ultrapure water was used throughout the experiments. The solutions of metal ions were prepared from their nitrates, and the solutions of anions were prepared from their sodium salts. The UV-Vis absorption spectra were determined at room temperature on a Shimadzu UV-2600 spectrophotometer in a 1 cm quartz cell. The pH values were determined with a model pHS-25 pH meter. High-resolution mass spectrometry (HRMS) were performed in a micro TOF-QⅡ mass spectrometer (USA). 1H/13CNMR (400 MHz) spectra was recorded on a Bruker Advance 400 spectrometer(Germany),with DMSO-d6 used as a solvent and tetramethylsilane (TMS) as an internal standard.
1.2 Experimental method
1.2.1 Synthesis of probe PAH
Probe PAH was synthesized according to the reported procedures[
1.2.2 Preparation of solutions
Phosphate buffer saline (PBS) with different pH from 2.0 to 12.0 was prepared from disodium hydrogen phosphate, dihydrogen phosphate and sodium chloride in a certain proportion with ultrapure water[
1.2.3 General procedure for analysis
Before conducting the spectroscopic measurements, the corresponding solutions of probe PAH and the reactive species (metal ions, anions, ROS and RNS) were freshly prepared. For UV-Vis selective experiments, test solutions were prepared by placing 0.6 mL of the probe PAH solution (0.5 mmol·L-1) and 0.12 mL of reactive species solutions in the absence and presence of 0.12 mL of ClO- solutions (8 mmol·L-1) into a 3 mL cuvette, and then diluting the solution to 3 mL with PBS (0.01 mol·L-1, pH 5.0). For UV-Vis titrations, 0.6 mL of the probe PAH solution and different amounts of ClO- was added into a 3 mL cuvette. These solutions were diluted with PBS (0.01 mol·L-1, pH 5.0) to 3 mL and mixed, then the spectra of these solutions were immediately recorded through the UV-Vis method.
2 Results and discussion
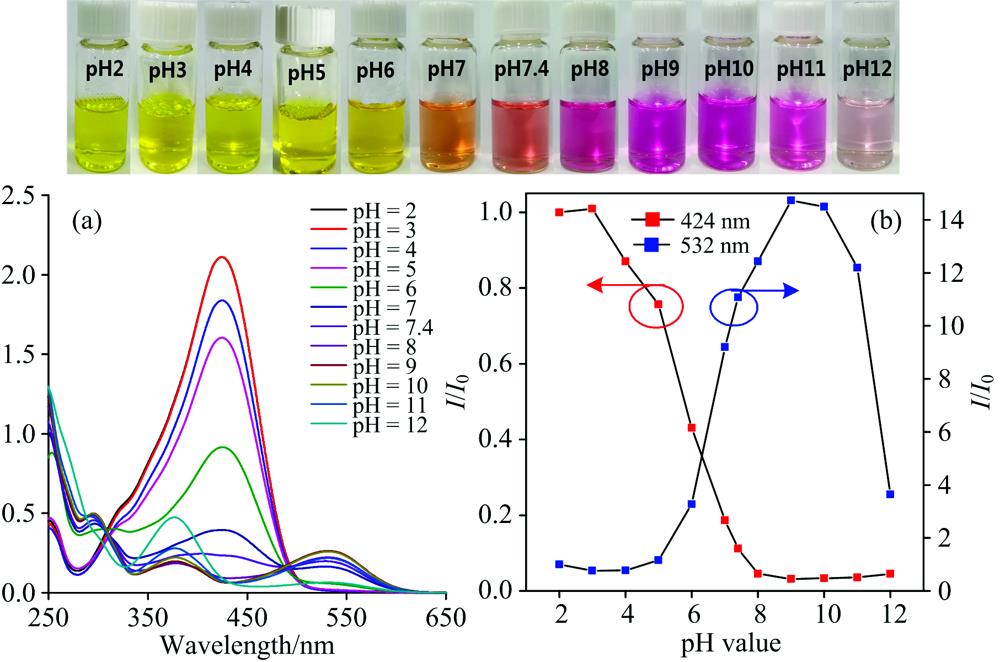
2.1 The pH effect to PAH
Previous reports indicated that PAH would undergo decomposition depending on the pH of the aqueous solution[
![]()
Figure 4.UV-Vis absorption spectra (a—d) of PAH (0.1 mmol·L-1) with the addition of N
2.2 Selectivity recognition toward ClO-
A colorimetric probe’s high selectivity and sensitivity are key parameters for real applications in tap water monitoring and in vivo studies. Thus, the UV-Vis response of PAH toward metal ions and anions, reactive oxygen species (ROS) and reactive nitrogen species (RNS) was evaluated in pH 5.0 buffered solution as presented in Fig.2 and in Fig.S3. Clearly, except for ClO-, the PAH solution (0.1 mmol·L-1) still displays a yellow color, and the corresponding UV-Vis spectra indicated that the absorption behavior exhibited slight changes after the addition of 4 equiv. The various extra species, such as metal ions and anions, reactive oxygen species (ROS) and reactive nitrogen species (RNS). Furthermore, by adding the same concentration of ClO- into the solution containing the PAH and the metal ion species, the absorption peak at 424 nm disappeared and the solution color changed from yellow to colorless [Figure 2 (a) and (d)]. The results indicated that the PAH exhibited a highly selective response toward ClO- with great anti-interference ability to other species. Furthermore, when the ClO- adding into the mixture of PHA and various anions, the UV-Vis spectra show only slight changes excepted the reductive anions, such as I-, ONOO-, N , GSH and Vc anion.[Figure 2(b), (c), (e) and (f)] For example, in the presence of I- anions, the solution color changes from yellow to purple, which may be attributed to the strong oxidation activity of ClO-, which can preferentially react with the I- or ONOO-, N , GSH and Vc and consume ClO-via a redox reaction process.
![]()
Figure 5.UV-Vis absorption spectra of indolinium in the absence/presence of ClO- in aqueous solution and UV-Vis absorption spectra of probe PAH (0.1 mmol·L-1) in the presence of ClO- (0.12 mmol·L-1 or 0.4 mmol·L-1) in PBS (0.01 mol·L-1, pH 5.0); Photography of indolinium in the absence/presence of ClO- (inset)
![]()
Figure 6.UV-Vis spectra of probe PAH (0.1 mmol·L-1) with the addition of ClO- (0~1.4 mmol·L-1) in PBS (0.01 mol·L-1) in pH 3.0 (a), pH 4.0 (b), pH 5.0 (c), pH 6.0 (d), pH 7.0 (e), pH 8.0 (f), pH 9.0 (g), pH 10.0 (h), pH 11.0 (i), pH 12.0 (j), respectively; The photography change of visible color of probe PAH toward ClO- under sunlight (inset)
Further, the effect of I-, ONOO-, N
, GSH and Vc toward ClO- detection was investigated. Take the iodide ion (I-) as an example (Fig.3). The mixture of PAH and I- displays a yellow color, and a maximum absorption peak at 424 nm. While adding the ClO- to the solution, the UV-Vis spectra indicated a new absorption peak at 550 nm, and upon increasing the concentration from 0 to 1.6 mmol·L-1, the new absorption peak at 550 nm disappeared.The chemical reaction involved the following two steps, (1) the presence of I- can react with ClO- to achieve I2, (2) both the presence of the oxidant of I2 and the extra ClO- would further decompose the probe[
![]()
Figure 7.Comparison of the interaction time between PAH (0.1 mmol·L-1) and ClO- (0.8 mmol·L-1) in aqueous solution of PBS (0.01 mol·L-1, pH 2.0~12.0)
2.3 UV-Vis absorbance response of probe PAH towards ClO-
![]()
Figure 8.HRMS of intermediate 1
The peak (
The recognition ability of probe PAH toward ClO- was measured using UV-Vis titrations in buffered aqueous solution (PBS, 0.01 mol·L-1, pH 5.0). As shown in Fig.4, with increasing ClO- concentrations, the absorption peak of probe PAH at 424 nm gradually decreased and the short absorption wavelength centering around 296 nm gradually increased, accompanied by a change in the color of the solution from yellow to colorless. Moreover, a well-defined isosbestic point was observed at 315 nm, indicating the formation of a single new species. In addition, the UV-Vis titration experiments between the corresponding absorbance values at 424 nm and ClO- concentrations exhibited an excellent linear correlation with a high coefficient (y=1.586 78-0.524 51x, R2=0.998 52) in the range of 0~0.28 mmol·L-1 [Fig.4(c)].Thus, the detection limit of probe PAH for ClO- detection was determined to be 5.39 μmol·L-1 according to the IUPAC definition (CDL=3Sb/m, Sb is the standard deviation of the blank samples, m is the slope of the linear equation) from 10 blank solutions[
![]()
Figure 9.HRMS of 2-hydroxybenzoic acid
The peak (
It is noteworthy that on the addition of a small amount of ClO- to the solution of probe PAH, a new absorption band appeared in the range from 500~570 nm, while following an increase in the concentration of ClO-, the absorption gradually disappeared again. We hypothesized that the new long absorption band originated from the degraded compound of indolinium, which strongly agrees with our experiment results (Fig.S5).
![]()
Figure 10.HRMS of intermediate 2
The peak (
2.4 The pH effect toward ClO- detection
The pH value of the environment is a crucial parameter that can affect the selectivity, sensitivity, and detection limit of a probe[
2.5 Recognition mechanism
The pH-dependence of the UV-Vis spectra showed that the probe PAH exhibited color-tunable properties from yellow to purple then to pink. There were two pathways to the hydrolysis of PAH in acidic and alkaline environment. In acidic environments (pH 2.0~5.0), the H+ would attack the S to balance the electric charge form [PAH]+, and the PAH solution keep yellow color; while under alkaline conditions, the neutralization reaction prefered to occur with [PAH]- between the OH group with an extra OH- in the molecular structure of PAH; hydrolysis of PAH under strongly alkaline conditions, and the solution changed to purple colour, due to the intramolecular interaction. On the other hand, the oxidative property of the hypochlorite anion could improve under acidic conditions and can accelerate the oxidation reaction compared to under alkaline conditions (Fig.S7). Based on our experiment results, a possible recognition mechanism was proposed in Scheme 2.
Firstly, in the presence of ClO-, oxidation cleavage of the C=C double of PAH would afford the 2-hydroxybenzoic acid/salicylaldehyde and indolinium derivative depending on the pH conditions. In the pH range from 7.0 to 12.0, when the [PAH]- encountered ClO-, it would be oxidized to 2 and salicylaldehyde, while at pH 2.0~6.0, the [PAH]+ can be oxidized to indolinium fragment 1 with 2-hydroxybenzoic acid. The detailed information of the molecular structures was supported by mass spectrometry and is listed in Fig.S8—Fig.S10.
On titration of hypochlorite under acidic conditions, HRMS data manifested the peaks at m/z=160.111 89 and 139.038 97, corresponding to the intermediates 1 and 2-hydroxybenzoic acid; while under basic conditions, HRMS gives result for m/z=123.044 06 and 282.115 84 consistent with intermediate 2 and salicylaldehyde, respectively.
2.6 Detection of ClO- in 84 disinfectant and tap water samples
Hypochlorite is widely used in our daily life. Thus, the probe PAH had been applied to analyse the content of ClO- in real samples (such as 84 disinfectant and tap water). The real sample was filtered for the removal of insoluble species. In a PBS (0.01 mol·L-1, pH 5.0) solution of 3 mL containing the probe PAH (0.1 mmol·L-1), the sample of 84 disinfectants was added with different volumes of 2.0, 4.0, 6.0 μL, respectively. The calculated concentration of ClO- of this 84 disinfectant sample is (151±6.68) mmol·L-1 (Table 1), According to the linear regression equation of UV-Vis titration (y=1.586 78-0.524 51x, R2=0.998 52). Further, the content of ClO- in tap water and purified water were also measured under the same conditions, and the calculated concentration of ClO- is 7.96 μmol·L-1 for the tap water sample (Table 1). Except for one sample, the percentage recoveries were in the range of 93%~103%. These results indicated that the probe PAH could potentially be used for the quantitative detection of ClO- concentrations in real water samples.
3 Conclusions
In conclusion, based on the oxidative activity of ClO-, the PAH can be utilized as a highly selective colorimetric naked-eye probe for ClO- detection via oxidative cleavage of itself in absolute aqueous solution, which leads to a tunable color process from yellow to purple then to colorless. The specificity of probe PAH can work in water environments, and coexisting ions only show a slight effect on ClO- detection. More importantly, acidic solid conditions accelerate the response time. Moreover, PAH exhibited a fast response time and naked eye detection toward ClO- at various pH values with highly-sensitive detection at pH 5.0. We have also successfully applied the probe to detect ClO- in real water samples. This research will open up new avenues for developing novel “naked-eye” probes for the detection of environmental pollutants in an absolute aqueous system.
References
[1] A Pritchard K, N Dittel B, A Strzepa. Cellular Immunology, 317, 1(2017).
[2] Jie MA, Fa-qin DONG, Ting-ting HUO et al. Spectroscopy and Spectral Analysis, 38, 1492(2018).
[3] K Yue Y, X Yin C, J Huo F et al. Analyst, 141, 1859(2016).
[4] Wen-ling WANG, Jin LEI, Qing-ming WANG et al. Spectrochimica Acta Part A: Molecular and Biomolecular Spectroscopy, 211, 239(2019).
[5] F Chai, P Lin, R Zhang et al. Microchimica Acta, 183, 1235(2016).
[6] B Claver J, L F Capitán-Vallvey, M C V Mirón. Analytica Chimica Acta, 522, 267(2004).
[7] P Pastore, F Magno, A Gallina. Analyst, 124, 1439(1999).
[8] . GB 5749—2006 Sanitary Standards for Drinking Water(2006).
[9] Y Wang, Q Han, F Zhou et al. Molecules, 24, 2455(2019).
[10] H Cui J, W Lu Y, Y Ning Y et al. Sensors and Actuators B: Chemical, 269, 322(2018).
[11] Z Tang B, J Zhang, X Feng et al. Journal of Materials Chemistry C, 7, 6932(2019).
[12] Z Shi, Y Liao, P Peng et al. Journal of the American Chemical Society, 133, 14699(2011).
[13] C Jin, Y Jiang, S Wu et al. Sensors and Actuators B: Chemical, 265, 365(2018).
[14] J Song, Z Wang, Y Zhang et al. Dyes and Pigments, 161, 172(2019).
[15] Y Zhang, J Song, Z Wang et al. Sensors and Actuators B: Chemical, 284, 148(2019).
[16] N Abeyrathna, Y Liao. Journal of Physical Organic Chemistry, 30, 1(2016).
[17] M Li, C Wang, H Ji et al. Faraday Discussions, 427(2017).
[18] Gao ZHOU, Ze-zhong CHEN, Feng FENG et al. Spectroscopy and Spectral Analysis, 37, 2799(2017).
[19] Z Tang B, Y Li, X Feng et al. Advanced Functional Materials, 28, 1802833(2018).

Set citation alerts for the article
Please enter your email address
© Copyright 2018-2021 | Chinese Laser Press. All Rights Reserved 沪ICP备15018463号-20