• Matter and Radiation at Extremes
  • Vol. 6, Issue 2, 026902 (2021)
Qianrui Liu1, Junyi Li2, and Mohan Chen1、a)
Author Affiliations
  • 1CAPT, HEDPS, College of Engineering, Peking University, Beijing 100871, People’s Republic of China
  • 2School of Computer Science and Technology, Harbin Institute of Technology (Shenzhen), Shenzhen, Guangdong 518055, People’s Republic of China
  • show less
    DOI: 10.1063/5.0030123 Cite this Article
    Qianrui Liu, Junyi Li, Mohan Chen. Thermal transport by electrons and ions in warm dense aluminum: A combined density functional theory and deep potential study[J]. Matter and Radiation at Extremes, 2021, 6(2): 026902 Copy Citation Text show less
    Convergence of frequency-dependent electronic thermal conductivity κe(ω) of Al with respect to the number of atomic configurations (snapshots) selected from DPMD trajectories. The temperature is set to (a) 0.5 eV and (b) 5.0 eV. The number of snapshots used together with the KG formula (the broadening parameter is set to 0.4 eV) is shown by different line styles. The DP model is trained from the OFDFT trajectories using the PBE XC functional. The simulation cell contains 108 atoms.
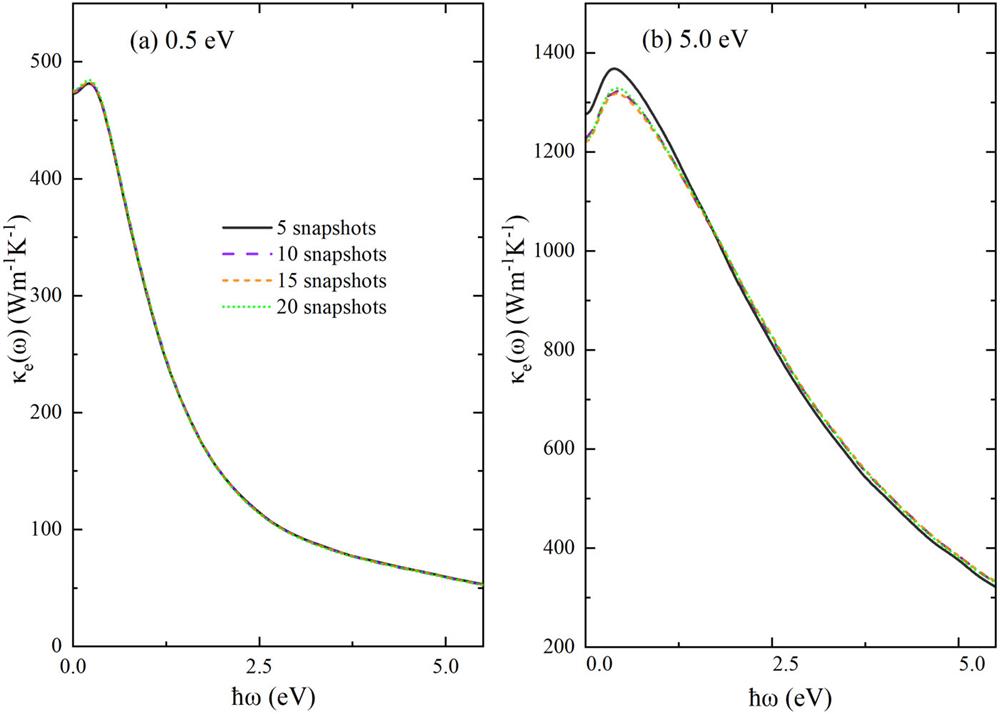
    Fig. 1. Convergence of frequency-dependent electronic thermal conductivity κe(ω) of Al with respect to the number of atomic configurations (snapshots) selected from DPMD trajectories. The temperature is set to (a) 0.5 eV and (b) 5.0 eV. The number of snapshots used together with the KG formula (the broadening parameter is set to 0.4 eV) is shown by different line styles. The DP model is trained from the OFDFT trajectories using the PBE XC functional. The simulation cell contains 108 atoms.
    Frequency-dependent Onsager kinetic coefficients (a) L11, (b) L12, and (c) L22 of Al at a temperature of 0.5 eV as computed using the KS, OF, DP-KS, and DP-OF methods. DP-KS and DP-OF refer to the DP models trained from OFDFT and KSDFT molecular dynamics trajectories, respectively. The broadening parameter used in the KG method is set to 0.4 eV. The simulation cell contains 64 Al atoms. (d) shows the improvement in the results for L12 obtained by using 40 rather than 20 snapshots.
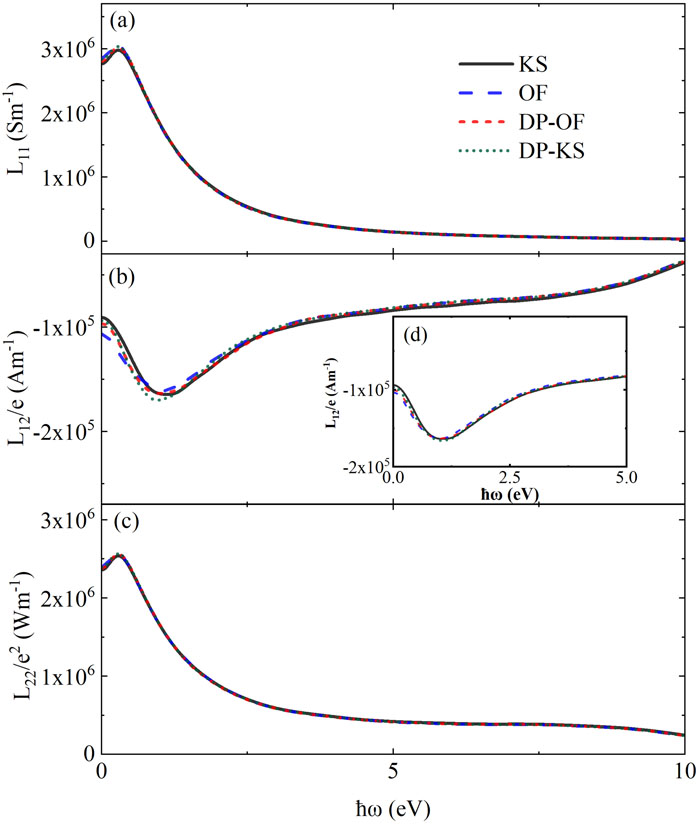
    Fig. 2. Frequency-dependent Onsager kinetic coefficients (a) L11, (b) L12, and (c) L22 of Al at a temperature of 0.5 eV as computed using the KS, OF, DP-KS, and DP-OF methods. DP-KS and DP-OF refer to the DP models trained from OFDFT and KSDFT molecular dynamics trajectories, respectively. The broadening parameter used in the KG method is set to 0.4 eV. The simulation cell contains 64 Al atoms. (d) shows the improvement in the results for L12 obtained by using 40 rather than 20 snapshots.
    Frequency-dependent electronic thermal conductivity κe(ω) as computed using the KG method (the broadening parameter is set to 0.4 eV) with snapshots from KS, OF, DP-KS, and DP-OF molecular dynamics trajectories. The temperatures are (a) 0.5 eV, (b) 1.0 eV, and (c) 5.0 eV. DP-KS and DP-OF refer to the DP models trained from OFDFT and KSDFT molecular dynamics trajectories, respectively. The cell contains 64 Al atoms.
    Fig. 3. Frequency-dependent electronic thermal conductivity κe(ω) as computed using the KG method (the broadening parameter is set to 0.4 eV) with snapshots from KS, OF, DP-KS, and DP-OF molecular dynamics trajectories. The temperatures are (a) 0.5 eV, (b) 1.0 eV, and (c) 5.0 eV. DP-KS and DP-OF refer to the DP models trained from OFDFT and KSDFT molecular dynamics trajectories, respectively. The cell contains 64 Al atoms.
    Convergence of frequency-dependent electronic thermal conductivity κe(ω) of Al with respect to the number of k-points. The temperature is set to 1.0 eV. The k-point samplings utilized with the KG method (the broadening parameter is set to 0.4 eV) are chosen from 1 × 1 × 1 to 4 × 4 × 4. The DP model is trained from the OFDFT trajectories using the PBE XC functional. The cell consists of 64 atoms.
    Fig. 4. Convergence of frequency-dependent electronic thermal conductivity κe(ω) of Al with respect to the number of k-points. The temperature is set to 1.0 eV. The k-point samplings utilized with the KG method (the broadening parameter is set to 0.4 eV) are chosen from 1 × 1 × 1 to 4 × 4 × 4. The DP model is trained from the OFDFT trajectories using the PBE XC functional. The cell consists of 64 atoms.
    Convergence of the electronic thermal conductivity κe(ω) with respect to the number of atoms (from 16 to 432) in the simulation cell. The temperature is set to (a) 0.5 eV, (b) 1.0 eV, and (c) 5.0 eV. (d)–(f) are magnified views of the peaks in (a)–(c), respectively. For the temperature of 0.5 eV, two 432-atom snapshots with 2 × 2 × 2 k-points are chosen to test the convergence of κe(ω). The DP model is trained from the OFDFT trajectories using the PBE XC functional. The broadening parameter is set to 0.4 eV.
    Fig. 5. Convergence of the electronic thermal conductivity κe(ω) with respect to the number of atoms (from 16 to 432) in the simulation cell. The temperature is set to (a) 0.5 eV, (b) 1.0 eV, and (c) 5.0 eV. (d)–(f) are magnified views of the peaks in (a)–(c), respectively. For the temperature of 0.5 eV, two 432-atom snapshots with 2 × 2 × 2 k-points are chosen to test the convergence of κe(ω). The DP model is trained from the OFDFT trajectories using the PBE XC functional. The broadening parameter is set to 0.4 eV.
    Density of states of a 256-atom cell at temperatures of (a) 0.5 eV and (b) 5.0 eV. The Fermi–Dirac function at the same temperature is plotted as a black solid line. The DP-OF model refers to the DP model trained from OFDFT molecular dynamics trajectories.
    Fig. 6. Density of states of a 256-atom cell at temperatures of (a) 0.5 eV and (b) 5.0 eV. The Fermi–Dirac function at the same temperature is plotted as a black solid line. The DP-OF model refers to the DP model trained from OFDFT molecular dynamics trajectories.
    Energy interval distribution function of different cells at (a) 0.5 eV and (b) 5.0 eV. Bands within 6.0 eV and 50.5 eV above the chemical potential μ are considered for temperatures of 0.5 eV and 5 eV, respectively. Different line styles correspond to different numbers of atoms (from 16 to 432) in the simulation cell. The DP model is trained from the OFDFT trajectories using the PBE XC functional.
    Fig. 7. Energy interval distribution function of different cells at (a) 0.5 eV and (b) 5.0 eV. Bands within 6.0 eV and 50.5 eV above the chemical potential μ are considered for temperatures of 0.5 eV and 5 eV, respectively. Different line styles correspond to different numbers of atoms (from 16 to 432) in the simulation cell. The DP model is trained from the OFDFT trajectories using the PBE XC functional.
    (a) Energy interval distribution function and (b) electronic thermal conductivity of a 256-atom cell at 0.5 eV. The snapshots are from DPMD simulations. The DPMD model is trained from OFDFT trajectories with the PBE XC functional. Different line styles represent different values of the broadening parameter σ.
    Fig. 8. (a) Energy interval distribution function and (b) electronic thermal conductivity of a 256-atom cell at 0.5 eV. The snapshots are from DPMD simulations. The DPMD model is trained from OFDFT trajectories with the PBE XC functional. Different line styles represent different values of the broadening parameter σ.
    Electronic thermal conductivities κe of warm dense Al. DP-KS and DP-OF refer to the DPMD models trained from KSDFT and OFDFT, respectively. Atomic configurations are generated from the DP-KS and DP-OF models. The broadening parameter is set to 0.4 eV. Note that nonlocal corrections have been neglected in this study. Results from Knyazev and Levashov,31 Vlcěk et al.,34 and Witte et al.,87 as well as experimental results from McKelvey et al.,88 are shown for comparison.
    Fig. 9. Electronic thermal conductivities κe of warm dense Al. DP-KS and DP-OF refer to the DPMD models trained from KSDFT and OFDFT, respectively. Atomic configurations are generated from the DP-KS and DP-OF models. The broadening parameter is set to 0.4 eV. Note that nonlocal corrections have been neglected in this study. Results from Knyazev and Levashov,31 Vlcěk et al.,34 and Witte et al.,87 as well as experimental results from McKelvey et al.,88 are shown for comparison.
    Autocorrelation function of heat current CJ(t) evaluated from different lengths of DPMD trajectories, namely, 25 ps, 125 ps, 250 ps, and 500 ps. The number of Al atoms in the cell is 10 684 and the temperature T = 0.5 eV. The DPMD model is trained from OFDFT with the PBE XC functional.
    Fig. 10. Autocorrelation function of heat current CJ(t) evaluated from different lengths of DPMD trajectories, namely, 25 ps, 125 ps, 250 ps, and 500 ps. The number of Al atoms in the cell is 10 684 and the temperature T = 0.5 eV. The DPMD model is trained from OFDFT with the PBE XC functional.
    Computed ionic thermal conductivity of warm dense Al at (a) 0.5 eV, (b) 1.0 eV, and (c) 5.0 eV for 12 different system sizes. The numbers of atoms per cell in these systems are N = 16, 32, 64, 108, 256, 1024, 5488, 8192, 10 648, 16 384, 32 000, and 65 536. The results are obtained through DPMD trained from OFDFT with the PBE XC functional.
    Fig. 11. Computed ionic thermal conductivity of warm dense Al at (a) 0.5 eV, (b) 1.0 eV, and (c) 5.0 eV for 12 different system sizes. The numbers of atoms per cell in these systems are N = 16, 32, 64, 108, 256, 1024, 5488, 8192, 10 648, 16 384, 32 000, and 65 536. The results are obtained through DPMD trained from OFDFT with the PBE XC functional.
    N0.5 eV1.0 eV5.0 eV
    168 × 8 × 87 × 7 × 73 × 3 × 3
    326 × 6 × 65 × 5 × 53 × 3 × 3
    643 × 3 × 33 × 3 × 31 × 1 × 1
    1082 × 2 × 22 × 2 × 21 × 1 × 1
    2162 × 2 × 22 × 2 × 21 × 1 × 1
    2562 × 2 × 22 × 2 × 21 × 1 × 1
    4322 × 2 × 2N/AN/A
    Table 1. Sizes of k-points adopted in KSDFT calculations to converge the electronic thermal conductivity of Al with different numbers N of atoms in the simulation cell at temperatures of 0.5 eV, 1.0 eV, and 5.0 eV.
    T (eV)κe(PP1)κe(PP2)κI
    0.5485.1486.61.422 ± 0.034
    DP-OF (PBE)1.0764.1772.31.469 ± 0.086
    5.01281.71604.62.091 ± 0.031
    0.5477.3475.61.394 ± 0.047
    DP-OF (LDA)1.0773.8779.01.318 ± 0.032
    5.01246.41568.52.141 ± 0.051
    0.5466.51.419 ± 0.038
    DP-KS (PBE)1.0771.01.393 ± 0.066
    5.01305.82.075 ± 0.066
    Table 2. Electronic thermal conductivity κe and ionic thermal conductivity κI (both in units of W m−1 K−1) at temperatures T of 0.5 eV, 1.0 eV, and 5.0 eV. The results are computed from the DP-KS and DP-OF molecular dynamics trajectories. DP-KS and DP-OF refer to the DP models trained from KSDFT and OFDFT molecular dynamics trajectories, respectively.
    Qianrui Liu, Junyi Li, Mohan Chen. Thermal transport by electrons and ions in warm dense aluminum: A combined density functional theory and deep potential study[J]. Matter and Radiation at Extremes, 2021, 6(2): 026902
    Download Citation