• Advanced Photonics
  • Vol. 5, Issue 3, 033001 (2023)
Fan Yang1, Mikhail Y. Shalaginov1, Hung-I Lin1, Sensong An1, Anu Agarwal1, Hualiang Zhang2, Clara Rivero-Baleine3, Tian Gu1、4、*, and Juejun Hu1、4、*
Author Affiliations
  • 1Massachusetts Institute of Technology, Department of Materials Science and Engineering, Cambridge, Massachusetts, United States
  • 2University of Massachusetts Lowell, Department of Electrical and Computer Engineering, Lowell, Massachusetts, United States
  • 3Lockheed Martin Corporation, Orlando, Florida, United States
  • 4Massachusetts Institute of Technology, Materials Research Laboratory, Cambridge, Massachusetts, United States
  • show less
    DOI: 10.1117/1.AP.5.3.033001 Cite this Article Set citation alerts
    Fan Yang, Mikhail Y. Shalaginov, Hung-I Lin, Sensong An, Anu Agarwal, Hualiang Zhang, Clara Rivero-Baleine, Tian Gu, Juejun Hu. Wide field-of-view metalens: a tutorial[J]. Advanced Photonics, 2023, 5(3): 033001 Copy Citation Text show less
    A VCD versus FOV plot comparing the VCD of several metalens designs (the blue and red solid lines correspond to optimized metalens doublets with 1-mm and 10-mm focal lengths, respectively), the empirical limit of conventional optics (purple dotted line), and those of ideal imaging systems following rectilinear projection (yellow and green solid lines assume a flat image sensor and a curved image sensor, respectively). Adapted from Ref. 36.
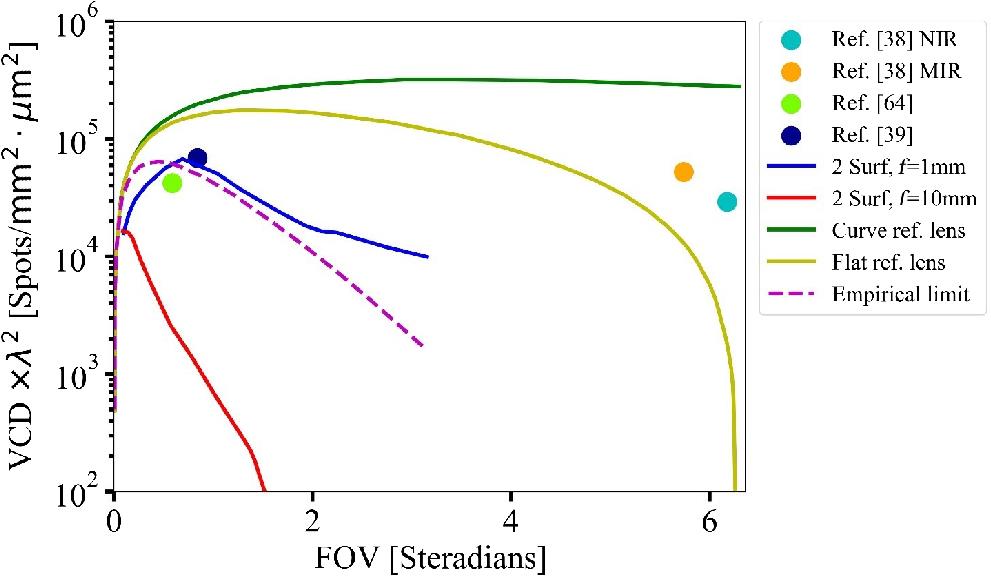
    Fig. 1. A VCD versus FOV plot comparing the VCD of several metalens designs (the blue and red solid lines correspond to optimized metalens doublets with 1-mm and 10-mm focal lengths, respectively), the empirical limit of conventional optics (purple dotted line), and those of ideal imaging systems following rectilinear projection (yellow and green solid lines assume a flat image sensor and a curved image sensor, respectively). Adapted from Ref. 36.
    An exemplary classical fisheye lens design (Nikkor 6 mm f/2.8 Fisheye), illustrating that the entrance pupil is much smaller in size than the lenses. Image courtesy of Shimizu.39" target="_self" style="display: inline;">39
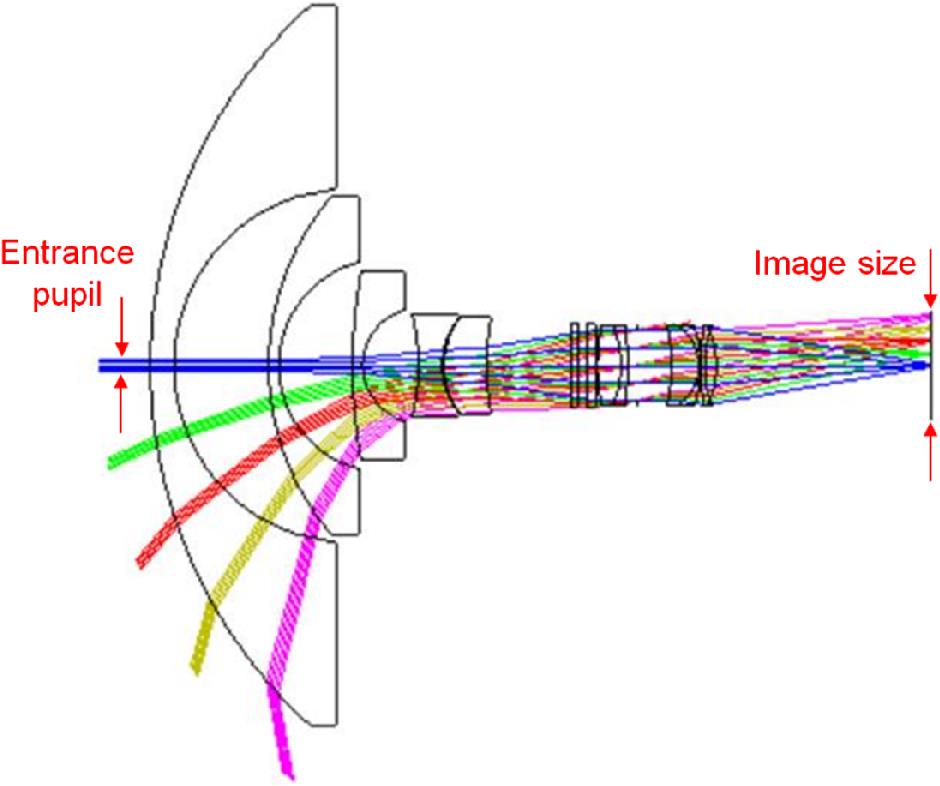
    Fig. 2. An exemplary classical fisheye lens design (Nikkor 6 mm f/2.8 Fisheye), illustrating that the entrance pupil is much smaller in size than the lenses. Image courtesy of Shimizu.39
    The curves plot size ratio between the image and the entrance pupil versus FOV for lenses with varying NAs calculated based on etendue conservation. The points correspond to experimentally validated designs from Ref. 40 (NA=0.24), 41 (NA=0.45), and 42 (NA=0.55).
    Fig. 3. The curves plot size ratio between the image and the entrance pupil versus FOV for lenses with varying NAs calculated based on etendue conservation. The points correspond to experimentally validated designs from Ref. 40 (NA=0.24), 41 (NA=0.45), and 42 (NA=0.55).
    (a) A WFOV lens comprising an aperture stop in front of a single-layer metasurface: the different colors label light rays incident from varying AOIs. Image courtesy of Shalaginov et al.40" target="_self" style="display: inline;">40 (b) Cross-sectional schematic of the metalens illustrating the different variables used in the analytical model.
    Fig. 4. (a) A WFOV lens comprising an aperture stop in front of a single-layer metasurface: the different colors label light rays incident from varying AOIs. Image courtesy of Shalaginov et al.40 (b) Cross-sectional schematic of the metalens illustrating the different variables used in the analytical model.
    A flat fisheye metalens with >170-deg diffraction-limited FOV operating at 5.2 μm wavelength. (a) Schematic of experimental setup for imaging a focal spot produced by the metalens at various AOIs. Examples of focal spot intensity images at (b) 0 deg, (c) 10 deg, (d) 30 deg, (e) 50 deg, (f) 70 deg, and (g) 85 deg. (h) Diffraction-limited focusing capability was concluded from the Strehl ratio values consistently above 0.8 threshold. Inset: Measured focal spot cross sections at 0 deg, 70 deg, and 85 deg AOIs (solid red lines); dotted black lines give theoretical results for aberration-free lens with the same f-number. (i) Metalens focusing efficiency was measured to be ∼40% at all AOIs. (j) Schematic of imaging setup. (k) Projected images of the 1951 USAF resolution test target with a period of 13.9 μm. Images courtesy of Shalaginov et al.40" target="_self" style="display: inline;">40
    Fig. 5. A flat fisheye metalens with >170-deg diffraction-limited FOV operating at 5.2  μm wavelength. (a) Schematic of experimental setup for imaging a focal spot produced by the metalens at various AOIs. Examples of focal spot intensity images at (b) 0 deg, (c) 10 deg, (d) 30 deg, (e) 50 deg, (f) 70 deg, and (g) 85 deg. (h) Diffraction-limited focusing capability was concluded from the Strehl ratio values consistently above 0.8 threshold. Inset: Measured focal spot cross sections at 0 deg, 70 deg, and 85 deg AOIs (solid red lines); dotted black lines give theoretical results for aberration-free lens with the same f-number. (i) Metalens focusing efficiency was measured to be 40% at all AOIs. (j) Schematic of imaging setup. (k) Projected images of the 1951 USAF resolution test target with a period of 13.9  μm. Images courtesy of Shalaginov et al.40
    Images taken with (a) a singlet lens with quadratic phase and (b) a singlet lens with hyperbolic phase. (c) Picture of the USAF resolution chart used in the experiment with the corresponding FOVs highlighted by the circles. (d) Measured transmission (dotted lines) and focusing efficiencies (dashed and solid lines) versus AOI for both polarizations. The focusing efficiency is normalized with respect to both total incident power on the entire metasurface (solid lines) and the transmission power (dashed lines). The focusing efficiencies were evaluated by integration of energy in the focal spot using a circular aperture with a radius of 7.5 μm (which equals 14.1λ). Images courtesy of Martins et al.41" target="_self" style="display: inline;">41
    Fig. 6. Images taken with (a) a singlet lens with quadratic phase and (b) a singlet lens with hyperbolic phase. (c) Picture of the USAF resolution chart used in the experiment with the corresponding FOVs highlighted by the circles. (d) Measured transmission (dotted lines) and focusing efficiencies (dashed and solid lines) versus AOI for both polarizations. The focusing efficiency is normalized with respect to both total incident power on the entire metasurface (solid lines) and the transmission power (dashed lines). The focusing efficiencies were evaluated by integration of energy in the focal spot using a circular aperture with a radius of 7.5  μm (which equals 14.1λ). Images courtesy of Martins et al.41
    Simulated intensity distributions of a quadratic phase singlet metalens (black colored) and a singlet metalens with a physical aperture stop (rosewood colored): (a) along the optical axis and (b) on the transverse planes corresponding to peak on-axis intensity. The z=0 plane coincides with the metasurface, and the intensity values are normalized to the peak intensity.
    Fig. 7. Simulated intensity distributions of a quadratic phase singlet metalens (black colored) and a singlet metalens with a physical aperture stop (rosewood colored): (a) along the optical axis and (b) on the transverse planes corresponding to peak on-axis intensity. The z=0 plane coincides with the metasurface, and the intensity values are normalized to the peak intensity.
    Schematic doublet lens designs for expanding the FOV. (a) Metalens doublet containing two metasurface layers on two sides of a substrate. (b) A classical doublet analog comprising a Schmidt plate for phase correction and a focusing lens. Images courtesy of Groever et al.43" target="_self" style="display: inline;">43 and Huang et al.71" target="_self" style="display: inline;">71
    Fig. 8. Schematic doublet lens designs for expanding the FOV. (a) Metalens doublet containing two metasurface layers on two sides of a substrate. (b) A classical doublet analog comprising a Schmidt plate for phase correction and a focusing lens. Images courtesy of Groever et al.43 and Huang et al.71
    Schematic diagram explaining the aberration suppression mechanism of a doublet metalens. Images courtesy of Martins et al.72" target="_self" style="display: inline;">72
    Fig. 9. Schematic diagram explaining the aberration suppression mechanism of a doublet metalens. Images courtesy of Martins et al.72
    Imaging performance comparison between a doublet metalens and a singlet metalens with the classical hyperbolic phase profile. (a), (b) Images taken with (a) the doublet and (b) the singlet lenses. (c), (d) Measured MTFs of (c) the doublet and (d) the singlet lenses. Images courtesy of Arbabi et al.42" target="_self" style="display: inline;">42
    Fig. 10. Imaging performance comparison between a doublet metalens and a singlet metalens with the classical hyperbolic phase profile. (a), (b) Images taken with (a) the doublet and (b) the singlet lenses. (c), (d) Measured MTFs of (c) the doublet and (d) the singlet lenses. Images courtesy of Arbabi et al.42
    A metalens designed with angular phase control. (a) The lens consists of five layers of silicon (black) embedded in an Al2O3 matrix (gray). (b) Finite-difference time-domain analysis of the far-field optical intensity distribution at four AOIs. (c) The modeled field intensities (circles) on the focal plane, which closely follow the ideal diffraction limit (solid lines). (d) AOI-dependent phase profile of the lens (red circles) overlaid with the ideal aberration-free phase profile (black line). Images courtesy of Lin et al.95" target="_self" style="display: inline;">95
    Fig. 11. A metalens designed with angular phase control. (a) The lens consists of five layers of silicon (black) embedded in an Al2O3 matrix (gray). (b) Finite-difference time-domain analysis of the far-field optical intensity distribution at four AOIs. (c) The modeled field intensities (circles) on the focal plane, which closely follow the ideal diffraction limit (solid lines). (d) AOI-dependent phase profile of the lens (red circles) overlaid with the ideal aberration-free phase profile (black line). Images courtesy of Lin et al.95
    Multiaperture design examples. (a) Schematic depiction of a 1-D metalens array, where each metalens is designed to cover a segment of the horizontal FOV. (b) A WFOV system based on a lenslet array coupled with meta-gratings for FOV rotation. Images courtesy of Chen et al.105" target="_self" style="display: inline;">105 and Zang et al.106" target="_self" style="display: inline;">106
    Fig. 12. Multiaperture design examples. (a) Schematic depiction of a 1-D metalens array, where each metalens is designed to cover a segment of the horizontal FOV. (b) A WFOV system based on a lenslet array coupled with meta-gratings for FOV rotation. Images courtesy of Chen et al.105 and Zang et al.106
    WFOV metalenses for endoscopy. (a) Schematics comparing endoscopes based on (top) convex lenses, (middle) GRIN lenses, and (bottom) metalenses. (b) A metalens doublet design demonstrating enhanced wide-field performance compared to a singlet design: (left) ray tracing simulations and (right) spot diagrams comparing the two designs. Note that image magnification of the doublet is twice of that of the singlet. Images courtesy of Liu et al.131" target="_self" style="display: inline;">131
    Fig. 13. WFOV metalenses for endoscopy. (a) Schematics comparing endoscopes based on (top) convex lenses, (middle) GRIN lenses, and (bottom) metalenses. (b) A metalens doublet design demonstrating enhanced wide-field performance compared to a singlet design: (left) ray tracing simulations and (right) spot diagrams comparing the two designs. Note that image magnification of the doublet is twice of that of the singlet. Images courtesy of Liu et al.131
    Schematic LABS device layout. Image courtesy of Li et al.167" target="_self" style="display: inline;">167
    Fig. 14. Schematic LABS device layout. Image courtesy of Li et al.167
    (a) Schematic top-view of the Luneburg-lens based beam steering device. (b) Schematic showing output from a waveguide feeds into the 2-D Luneburg lens which collimates the beam in-plane. Images courtesy of Kim et al.171" target="_self" style="display: inline;">171
    Fig. 15. (a) Schematic top-view of the Luneburg-lens based beam steering device. (b) Schematic showing output from a waveguide feeds into the 2-D Luneburg lens which collimates the beam in-plane. Images courtesy of Kim et al.171
    Bandwidth bounds for WFOV dispersion-engineered achromatic metalenses. Here, Δω, ω, f, and L denote the bandwidth bound, center frequency, focal length, and metasurface thickness, respectively. η is the maximum contrast in relative permittivity at any frequency within the entire band and any point within the metasurface. Image courtesy of Shastri et al.177" target="_self" style="display: inline;">177
    Fig. 16. Bandwidth bounds for WFOV dispersion-engineered achromatic metalenses. Here, Δω, ω, f, and L denote the bandwidth bound, center frequency, focal length, and metasurface thickness, respectively. η is the maximum contrast in relative permittivity at any frequency within the entire band and any point within the metasurface. Image courtesy of Shastri et al.177
    Comparison between all-planar and hybrid meta-optics. (a) Design and ray trace simulation of an all-planar meta-optic. (b)–(d) Simulated MTFs of the planar meta-optic across 100-deg FOV for 750, 1150, and 1550 nm wavelengths. (e) Design and ray trace simulation of a hybrid meta-optic. (f)–(h) Simulated MTFs of the hybrid meta-optic across 180-deg FOV for 750, 1150, and 1550 nm wavelengths.
    Fig. 17. Comparison between all-planar and hybrid meta-optics. (a) Design and ray trace simulation of an all-planar meta-optic. (b)–(d) Simulated MTFs of the planar meta-optic across 100-deg FOV for 750, 1150, and 1550 nm wavelengths. (e) Design and ray trace simulation of a hybrid meta-optic. (f)–(h) Simulated MTFs of the hybrid meta-optic across 180-deg FOV for 750, 1150, and 1550 nm wavelengths.
    (a), (b) Schematic illustration of the doublet zoom metalens configuration in the (a) wide-angle mode and (b) telephoto mode. MS-1 and MS-2 label the front and back metasurfaces, respectively. (c), (d) Ray trace simulation of the polarization-multiplexed zoom metalens in the (c) wide-angle mode and (d) telephoto mode. All the units are in mm. Images captured by the zoom metalens in the (e) wide-angle mode (scale bars: 10-deg FOV) and (f), (g) telephoto mode (scale bars: 1-deg FOV). Images courtesy of Yang et al.209" target="_self" style="display: inline;">209
    Fig. 18. (a), (b) Schematic illustration of the doublet zoom metalens configuration in the (a) wide-angle mode and (b) telephoto mode. MS-1 and MS-2 label the front and back metasurfaces, respectively. (c), (d) Ray trace simulation of the polarization-multiplexed zoom metalens in the (c) wide-angle mode and (d) telephoto mode. All the units are in mm. Images captured by the zoom metalens in the (e) wide-angle mode (scale bars: 10-deg FOV) and (f), (g) telephoto mode (scale bars: 1-deg FOV). Images courtesy of Yang et al.209
    End-to-end optimization of both the meta-optical front end and the reconstruction algorithm to minimize reconstruction error in computational imaging. Image courtesy of Arya et al.215" target="_self" style="display: inline;">215
    Fig. 19. End-to-end optimization of both the meta-optical front end and the reconstruction algorithm to minimize reconstruction error in computational imaging. Image courtesy of Arya et al.215
    Design typeFOV (deg)Focusing efficiency (%)Effective NAPhysical aperture size (mm)Wavelength (nm)VCD×λ2[(spots/mm2)·μm2]
    Singlet with an aperture stop40>17032 to 450.24152005.2×104
    Quadratic phase singlet41>1703.50.272532
    Metalens doublet4350500.440.315324.2×104
    Metalens doublet4260700.490.88506.9×104
    Metalens with angular phase control4416710.1250λ0.8λ to λ5.3×10³
    Table 1. A representative selection of WFOV metalens demonstrations: numbers only theoretically predicted without experimental validation are marked in boldfaced.
    Design architectureAdvantagesLimitations
    Singlet with an aperture stopSimple architecture, large FOVSignificant distortion at large AOIs, moderate NA
    Quadratic phase singletSimple architecture, large FOVLarge glare (stray background), significant distortion at large AOIs, limited resolution
    Metalens doubletEnhanced aberration correction capabilityIncreased complexity, significant distortion at large AOIs
    Metalens with angular phase controlUltrathin profile, high focusing qualityComplex design and fabrication
    Multiaperture arrayDistortion suppressionCurtailed optical throughput, requiring computational processing
    Table 2. Summary of comparison between different WFOV metalens architectures.
    Fan Yang, Mikhail Y. Shalaginov, Hung-I Lin, Sensong An, Anu Agarwal, Hualiang Zhang, Clara Rivero-Baleine, Tian Gu, Juejun Hu. Wide field-of-view metalens: a tutorial[J]. Advanced Photonics, 2023, 5(3): 033001
    Download Citation