
Chang Liu, Jin Zhao, Zihao Liu, Xiqiao Wang, Kuncheng Lai. Improved Lidar Obstacle Detection Method Based on Euclidean Clustering[J]. Laser & Optoelectronics Progress, 2020, 57(20): 201105
- Laser & Optoelectronics Progress
- Vol. 57, Issue 20, 201105 (2020)
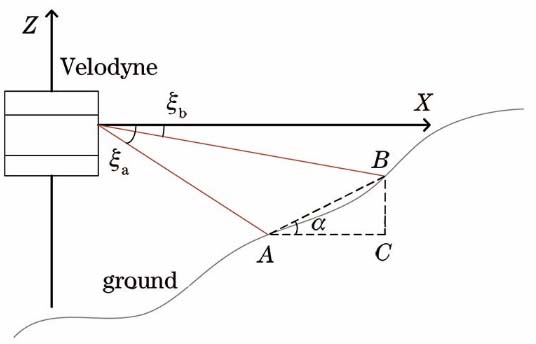
Fig. 1. Diagram of lidar scanning angle
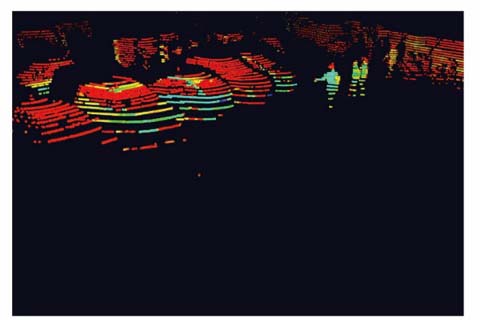
Fig. 2. Overlapping vehicles and close pedestrians
Fig. 3. Point cloud of road surface
Fig. 4. Ground removal
Fig. 5. Location between pedestrians and vehicles. (a) Ray diagram; (b) top view
Fig. 6. Diagram of angle
Fig. 7. Diagram of lidar segmentation
Fig. 8. Experimental platform. (a) Electric control car; (b) electric control equipment
Fig. 9. Principle of Bounding Box
Fig. 10. Ground removal. (a) Least square method; (b) RANSAC algorithm
Fig. 11. Local cluster comparison. (a) Point cloud map; (b) traditional Euclidean clustering algorithm; (c) improved Euclidean clustering algorithm
Fig. 12. Global cluster comparison. (a) Original point cloud; (b) traditional Euclidean clustering algorithm; (c) improved Euclidean clustering algorithm
|
Table 1. Comparison of ground segmentation
|
Table 2. Vehicles parked on roadside(165 vehicles)
|
Table 3. Pedestrian (113 pedestrians)
|
Table 4. Mobile vehicles including non-motorized vehicles (33 vehicles)


Set citation alerts for the article
Please enter your email address

© Copyright 2018-2021 | Chinese Laser Press. All Rights Reserved 沪ICP备15018463号-20