• Photonics Research
  • Vol. 10, Issue 12, B30 (2022)
Sangwon Baek1、†, Joohoon Kim2、†, Yeseul Kim2、†, Won Seok Cho1, Trevon Badloe2, Seong-Won Moon2, Junsuk Rho2、3、4、5、6、*, and Jong-Lam Lee1、7、*
Author Affiliations
  • 1Department of Materials Science and Engineering, Pohang University of Science and Technology (POSTECH), Pohang 37673, Republic of Korea
  • 2Department of Mechanical Engineering, Pohang University of Science and Technology (POSTECH), Pohang 37673, Republic of Korea
  • 3Department of Chemical Engineering, Pohang University of Science and Technology (POSTECH), Pohang 37673, Republic of Korea
  • 4POSCO-POSTECH-RIST Convergence Research Center for Flat Optics and Metaphotonics, Pohang 37673, Republic of Korea
  • 5National Institute of Nanomaterials Technology (NINT), Pohang 37673, Republic of Korea
  • 6e-mail:
  • 7e-mail:
  • show less
    DOI: 10.1364/PRJ.470004 Cite this Article Set citation alerts
    Sangwon Baek, Joohoon Kim, Yeseul Kim, Won Seok Cho, Trevon Badloe, Seong-Won Moon, Junsuk Rho, Jong-Lam Lee. High numerical aperture RGB achromatic metalens in the visible[J]. Photonics Research, 2022, 10(12): B30 Copy Citation Text show less
    (a) Schematic image of a low-loss hydrogenated amorphous silicon (a-Si:H) meta-atom on a glass substrate. (b) Top view of metalens building blocks with a rectangular array. (c) Measured refractive index n and extinction coefficient k of low-loss a-Si:H. (d)–(f) Simulated phase and transmittance for meta-atoms as a function of diameter (D) at λ of (d)450, (e) 532, and (f) 700 nm. Height(H)=600 nm; period (P)=230 nm for λ=450 nm; P=460 nm for λ=532 and 700 nm.
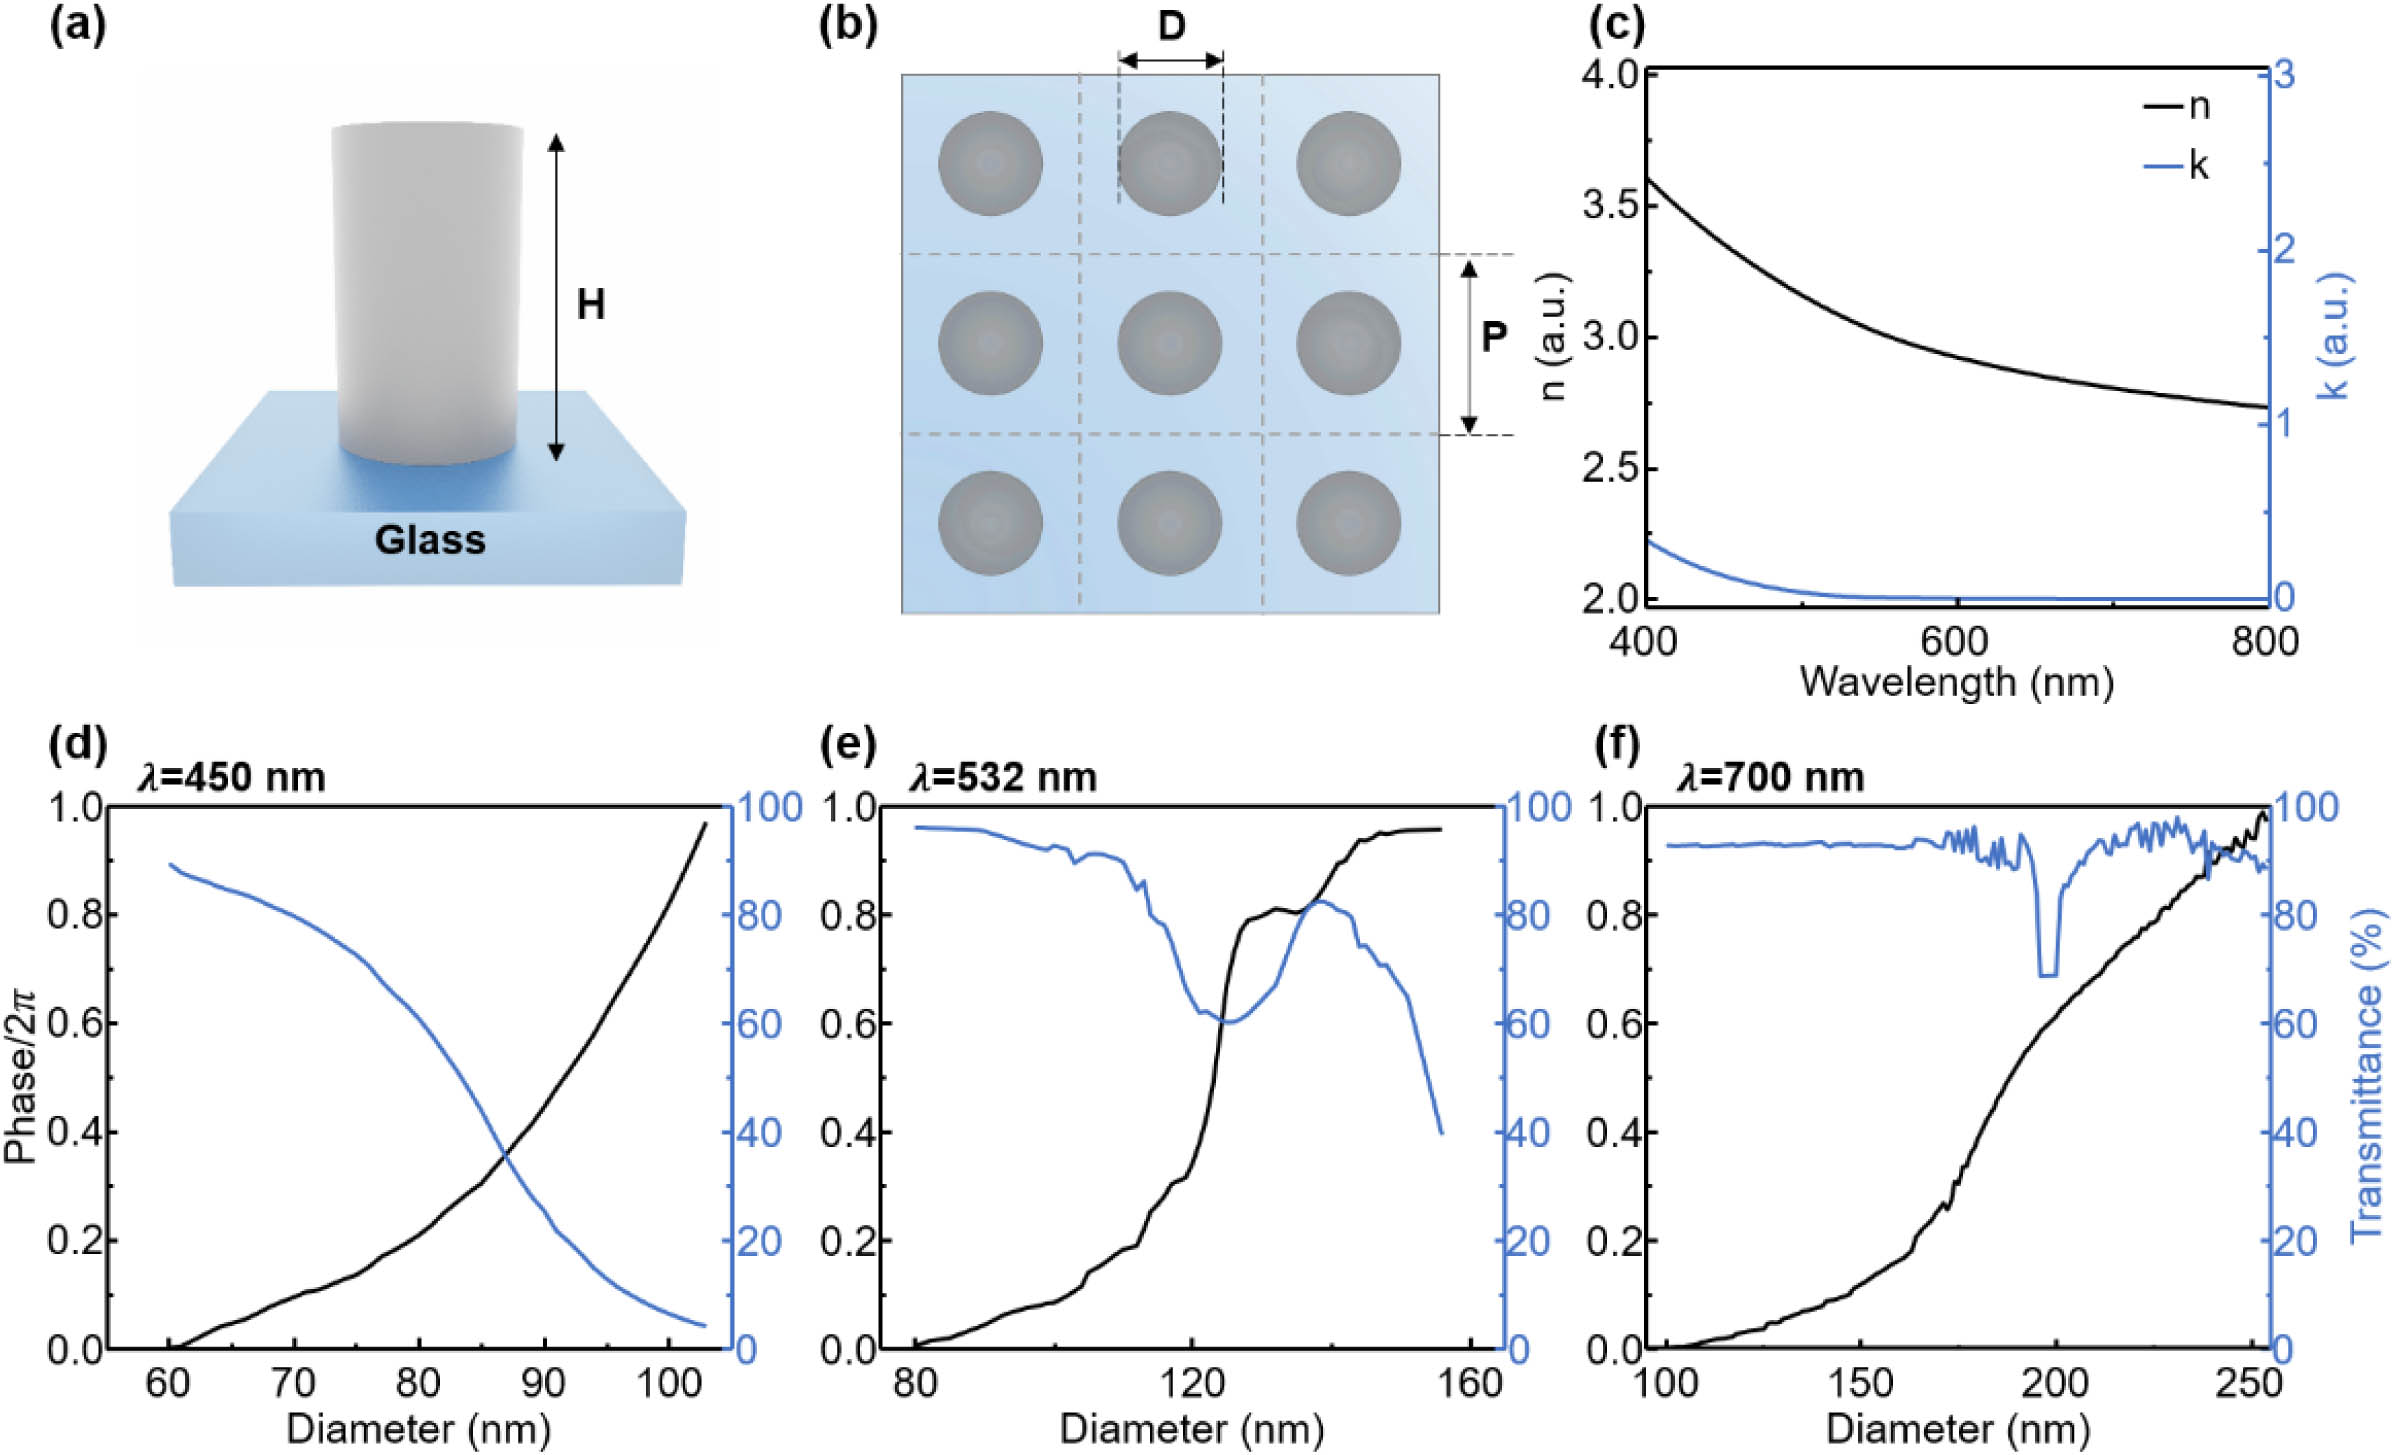
    Fig. 1. (a) Schematic image of a low-loss hydrogenated amorphous silicon (a-Si:H) meta-atom on a glass substrate. (b) Top view of metalens building blocks with a rectangular array. (c) Measured refractive index n and extinction coefficient k of low-loss a-Si:H. (d)–(f) Simulated phase and transmittance for meta-atoms as a function of diameter (D) at λ  of(d)450, (e) 532, and (f) 700 nm. Height(H)=600  nm; period(P)=230  nm for λ=450  nm; P=460  nm for λ=532 and 700 nm.
    (a) Schematic illustrations of spatial interleaving method with three meta-atoms: λ=450, 532, and 700 nm for blue, green, and red circles, respectively. (b) Simulated cross-sectional normalized electric field distributions of the metalens at λ=450 nm (top), 532 nm (middle), and 700 nm (bottom) in the focal region. (c)–(e) Calculated normalized electric field distributions at the focal spot at λ of (c)450 nm, (d) 532 nm, and (e) 700 nm. Scale bar: 500 nm.
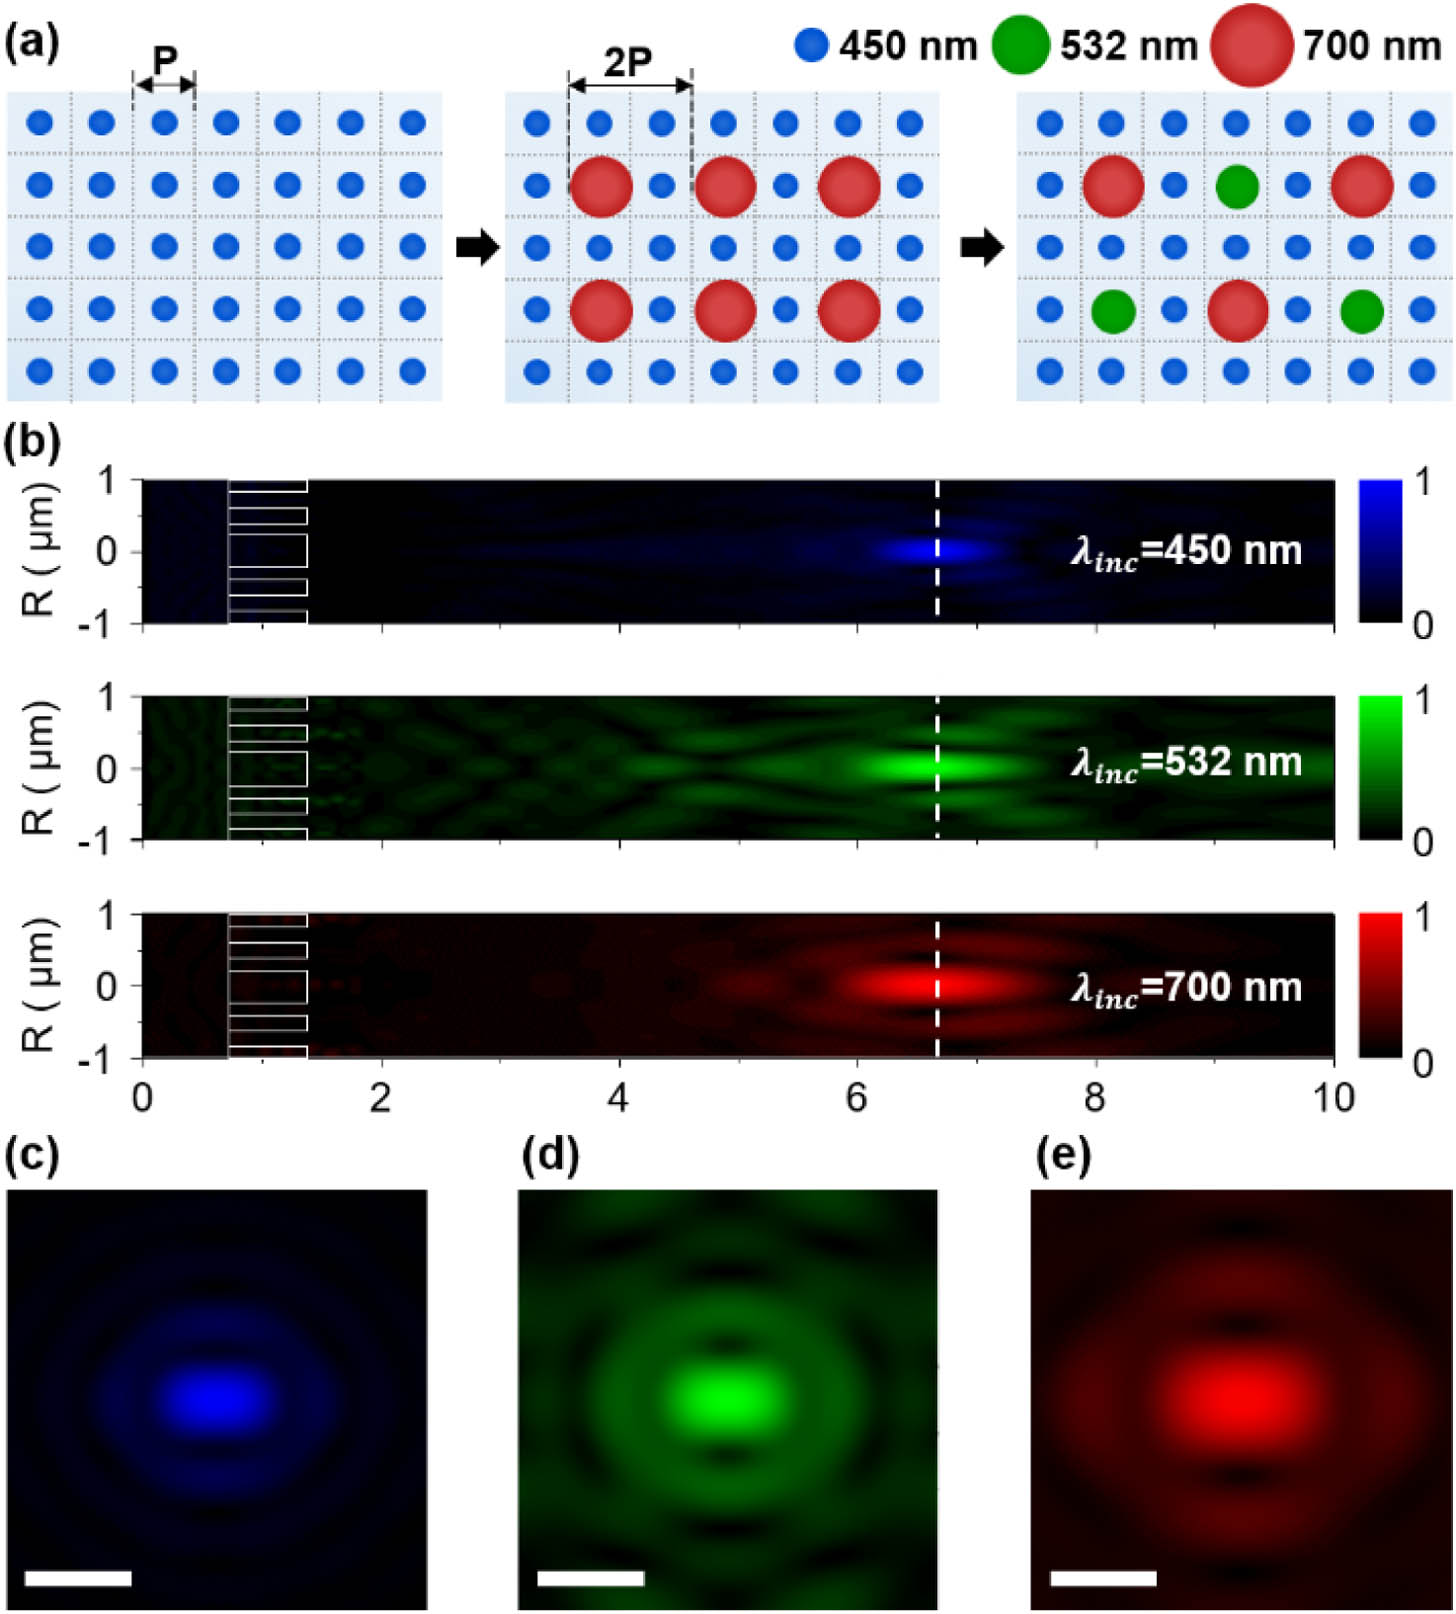
    Fig. 2. (a) Schematic illustrations of spatial interleaving method with three meta-atoms: λ=450, 532, and 700 nm for blue, green, and red circles, respectively. (b) Simulated cross-sectional normalized electric field distributions of the metalens at λ=450  nm (top), 532 nm (middle), and 700 nm (bottom) in the focal region. (c)–(e) Calculated normalized electric field distributions at the focal spot at λ  of(c)450  nm, (d) 532 nm, and (e) 700 nm. Scale bar: 500 nm.
    (a), (b) Scanning electron micrograph of the fabricated metalens for (a) top-down and (b) tilted SEM images. (c) Schematic illustration of the optical setup. (d) Normalized measured optical field intensity profiles at λ=450 nm (top), 532 nm (middle), and 700 nm (bottom).
    Fig. 3. (a), (b) Scanning electron micrograph of the fabricated metalens for (a) top-down and (b) tilted SEM images. (c) Schematic illustration of the optical setup. (d) Normalized measured optical field intensity profiles at λ=450  nm (top), 532 nm (middle), and 700 nm (bottom).
    (a)–(c) Captured image of the focal spot created by the metalens at λ of (a)450 nm, (b) 532 nm, and (c) 700 nm. (d)–(f) Normalized cross-sectional intensity profiles and Airy functions at λ of (d)450 nm, (e) 532 nm, and (f) 700 nm. (g)–(i) MTF of the metalens at λ of (g)450 nm, (h) 532 nm, and (i) 700 nm.
    Fig. 4. (a)–(c) Captured image of the focal spot created by the metalens at λof(a)450  nm, (b) 532 nm, and (c) 700 nm. (d)–(f) Normalized cross-sectional intensity profiles and Airy functions at λof(d)450  nm, (e) 532 nm, and (f) 700 nm. (g)–(i) MTF of the metalens at λof(g)450  nm, (h) 532 nm, and (i) 700 nm.
    (a) Experimental setup for imaging setup. (b) Captured image of a negative 1951 USAF resolution target using the SIM metalens at λ=532 nm.
    Fig. 5. (a) Experimental setup for imaging setup. (b) Captured image of a negative 1951 USAF resolution target using the SIM metalens at λ=532  nm.
    (a) Screen-capture system in bright and dark conditions. (b) Captured image of the same number “5” at λ=450, 532, and 700 nm.
    Fig. 6. (a) Screen-capture system in bright and dark conditions. (b) Captured image of the same number “5” at λ=450, 532, and 700 nm.
    Simulated transmission properties of the meta-atoms of 40 nm≤D≤110 nm, 400 nm≤H≤800 nm at λ=450 nm. (a) Phase. (b) Transmittance. The period was set to 230 nm, which satisfies the Nyquist sampling criteria. Black lines: optimized structures used in this work to achieve full-phase coverage with high efficiency.
    Fig. 7. Simulated transmission properties of the meta-atoms of 40nmD110  nm, 400nmH800  nm at λ=450  nm. (a) Phase. (b) Transmittance. The period was set to 230 nm, which satisfies the Nyquist sampling criteria. Black lines: optimized structures used in this work to achieve full-phase coverage with high efficiency.
    Simulated (a) phase and (b) transmittance of the meta-atoms of 60 nm≤D≤110 nm, 150 nm≤P≤250 nm at λ=450 nm. Simulated (c) phase and (d) transmittance of the meta-atoms of 80 nm≤D≤160 nm, 350 nm≤P≤500 nm at λ=532 nm. Simulated (e) phase and (f) transmittance of the meta-atoms of 100 nm≤D≤300 nm, 350 nm≤P≤500 nm at λ=700 nm. The H is set to 600 nm, which is the optimization result in Fig. 7. Black lines: optimized structures used in this work to achieve full-phase coverage with high transmittance while avoiding anomalous diffraction.
    Fig. 8. Simulated (a) phase and (b) transmittance of the meta-atoms of 60nmD110  nm, 150nmP250  nm at λ=450  nm. Simulated (c) phase and (d) transmittance of the meta-atoms of 80nmD160  nm, 350nmP500  nm at λ=532  nm. Simulated (e) phase and (f) transmittance of the meta-atoms of 100nmD300  nm, 350nmP500  nm at λ=700  nm. The H is set to 600 nm, which is the optimization result in Fig. 7. Black lines: optimized structures used in this work to achieve full-phase coverage with high transmittance while avoiding anomalous diffraction.
    (a) Schematic image of the custom-built setup for efficiency measurement depending on the polarization. (b) Measured focusing efficiency of the SIM metalens according to polarization variation.
    Fig. 9. (a) Schematic image of the custom-built setup for efficiency measurement depending on the polarization. (b) Measured focusing efficiency of the SIM metalens according to polarization variation.
    (a) Schematic image of slanted meta-atom on the glass substrate. (b)–(d) Simulated phase for slanted meta-atoms as a function of D at λof(b)450, (c) 532, and (d) 700 nm. Height (H)=600 nm; period(P)=230 nm for λ of 450 nm; P=460 nm for λ=532 and 700 nm. θ=2.5°, 3.5°, and 4.5° for λ=450, 532, and 700 nm, respectively.
    Fig. 10. (a) Schematic image of slanted meta-atom on the glass substrate. (b)–(d) Simulated phase for slanted meta-atoms as a function of D at λof(b)450, (c) 532, and (d) 700 nm. Height (H)=600  nm; period(P)=230  nm for λof450  nm; P=460  nm for λ=532 and 700 nm. θ=2.5°, 3.5°, and 4.5° for λ=450, 532, and 700 nm, respectively.
    Sangwon Baek, Joohoon Kim, Yeseul Kim, Won Seok Cho, Trevon Badloe, Seong-Won Moon, Junsuk Rho, Jong-Lam Lee. High numerical aperture RGB achromatic metalens in the visible[J]. Photonics Research, 2022, 10(12): B30
    Download Citation