
Huanyang Chen, Wen Xiao. Morse lens [Invited][J]. Chinese Optics Letters, 2020, 18(6): 062403
- Chinese Optics Letters
- Vol. 18, Issue 6, 062403 (2020)
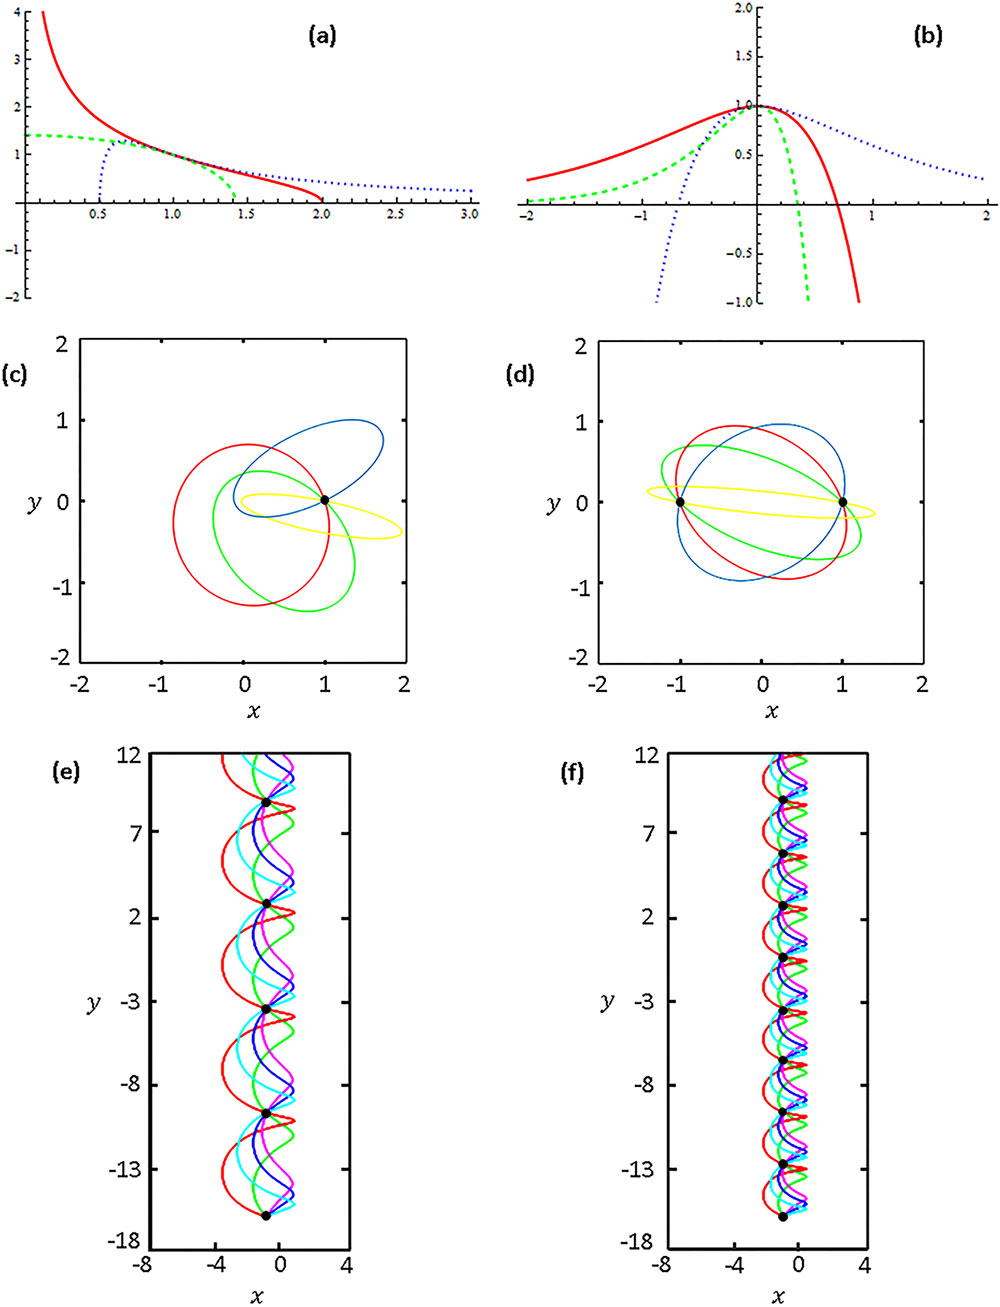
Fig. 1. (a) The refractive index profiles for the Eaton lens (red), the Luneburg Lens (green) and the anti-Eaton lens (blue). (b) Refractive index profile for the Morse lens with
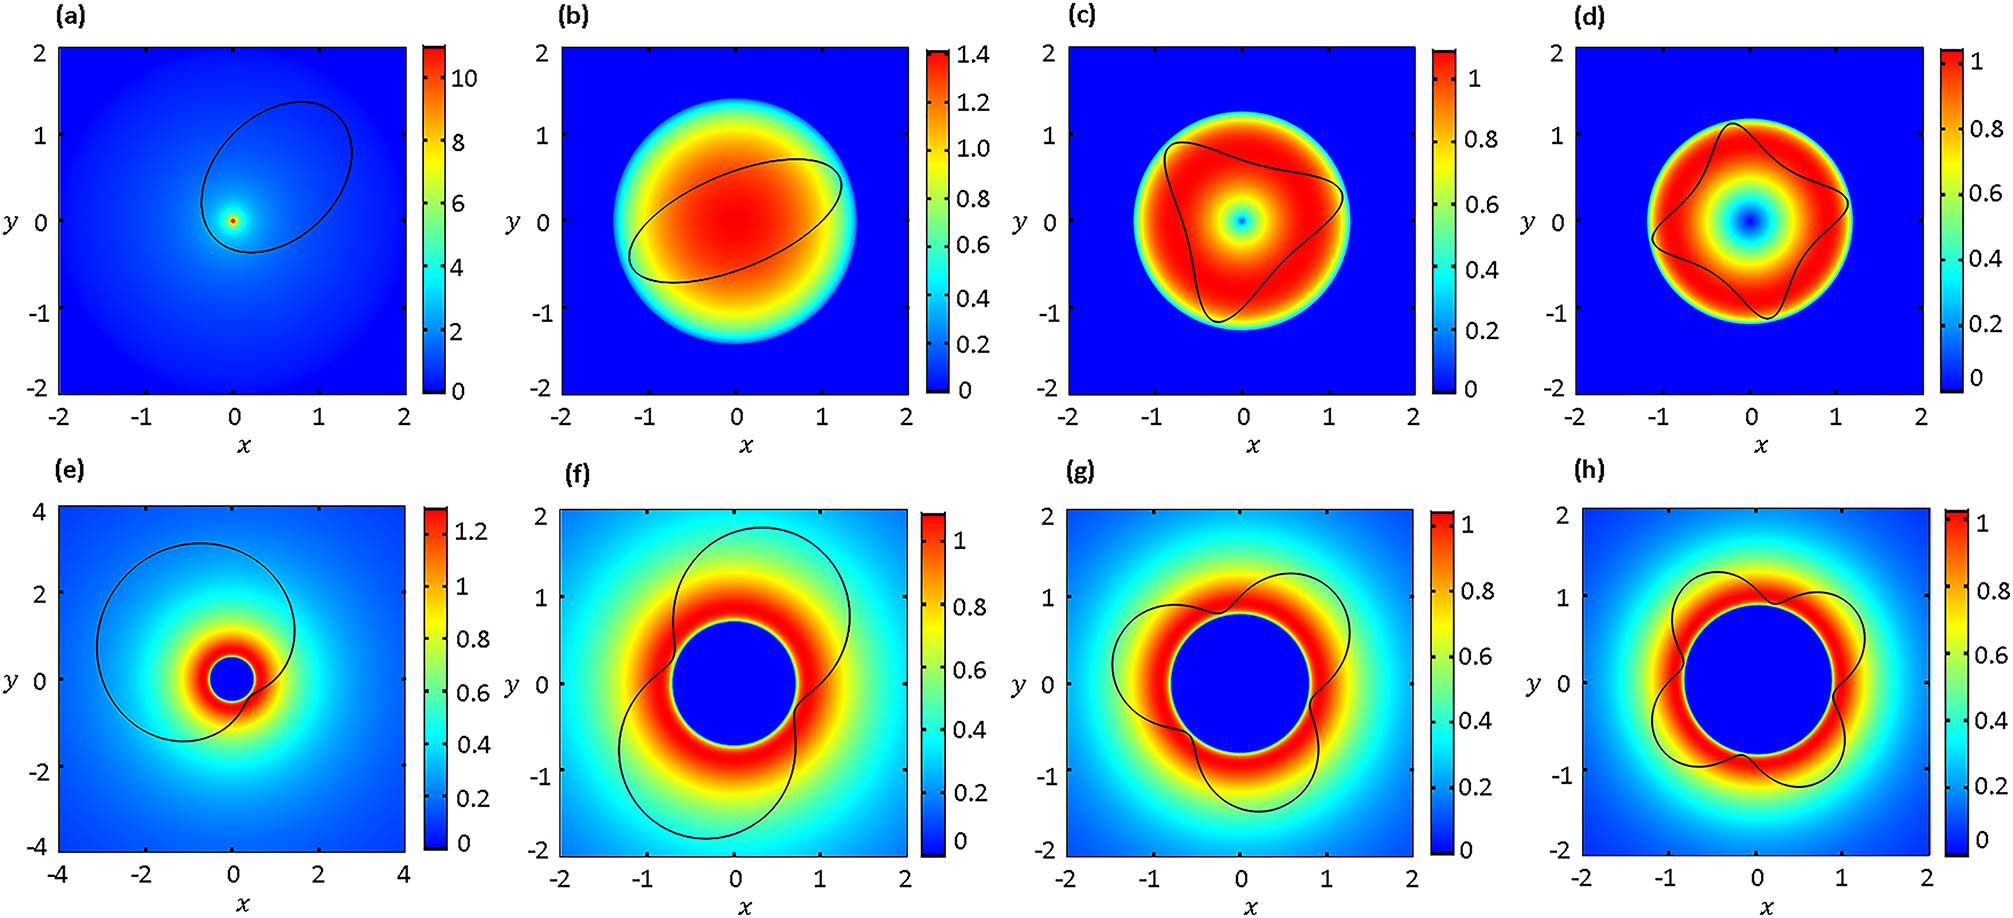
Fig. 2. The refractive index distribution (contour map) and trajectory (black curve) for a ray emitted from (1, 0) at 45° on a generalized Eaton/Luneburg lens with (a)
Fig. 3. The refractive index distribution (contour map) and trajectory (black curve) for a ray emitted from (1, 0) at 45° on a generalized Eaton/Luneburg lens with (a)
Fig. 4. (a) The 6–10 potential (red) and the 6–12 potential (green). (b) The refractive index profile of generalized Eaton/Luneburg lens with

Set citation alerts for the article
Please enter your email address
© Copyright 2018-2021 | Chinese Laser Press. All Rights Reserved 沪ICP备15018463号-20