• Photonics Research
  • Vol. 8, Issue 1, 51 (2020)
Zeferino Ibarra-Borja1, Carlos Sevilla-Gutiérrez1, Roberto Ramírez-Alarcón1、*, Hector Cruz-Ramírez2, and Alfred B. U’Ren2
Author Affiliations
  • 1Centro de Investigaciones en Óptica A.C., Loma del Bosque 115, Colonia Lomas del Campestre, 37150 León, Guanajuato, Mexico
  • 2Instituto de Ciencias Nucleares, Universidad Nacional Autónoma de México, Apartado Postal 70-543, 04510 DF, Mexico
  • show less
    DOI: 10.1364/PRJ.8.000051 Cite this Article Set citation alerts
    Zeferino Ibarra-Borja, Carlos Sevilla-Gutiérrez, Roberto Ramírez-Alarcón, Hector Cruz-Ramírez, Alfred B. U’Ren. Experimental demonstration of full-field quantum optical coherence tomography[J]. Photonics Research, 2020, 8(1): 51 Copy Citation Text show less
    (a) Standard configuration for QOCT based on HOM interference. (b) Typical QOCT interferogram, based on an A-scan, for a two-layer sample with reflectivities R1 and R2.
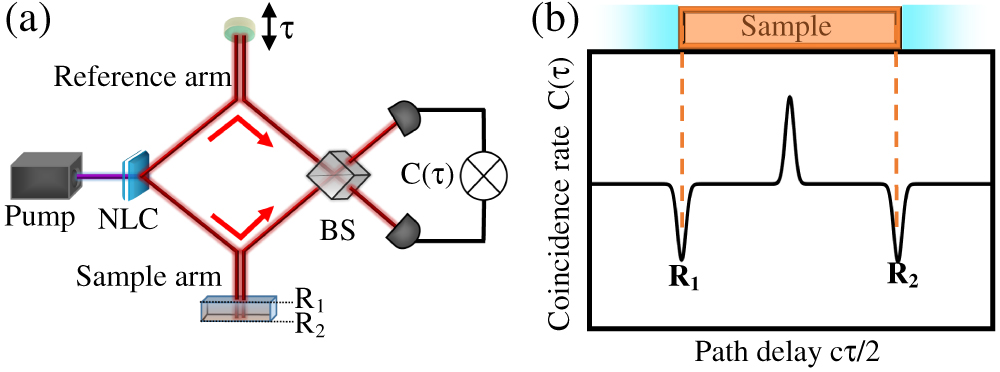
    Fig. 1. (a) Standard configuration for QOCT based on HOM interference. (b) Typical QOCT interferogram, based on an A-scan, for a two-layer sample with reflectivities R1 and R2.
    (a) FF-QOCT setup. (b) Schematic of the sample used showing the empty frame and the frame with the letter ψ imprinted on the front surface, along with the sample structure observed with a microscope. (c) Image-preserving OD.
    Fig. 2. (a) FF-QOCT setup. (b) Schematic of the sample used showing the empty frame and the frame with the letter ψ imprinted on the front surface, along with the sample structure observed with a microscope. (c) Image-preserving OD.
    For a single-layer sample (mirror): (a) and (c) experimental HOM dip for photon-pair source in configuration A (filtered), in panel (a), and for configuration B (unfiltered) in panel (c). The insets in panels (a) and (c) show the single-photon spectral distribution S(ω) measured at the single-mode fiber outputs. Both distributions are approximately rectangular in shape with bandwidths ∼10 nm and ∼50 nm, respectively. For the empty frame in the sample: (b) and (d) experimental QOCT interferogram for configuration A (filtered), in panel (b), and for configuration B (unfiltered) in panel (d). The continuous lines are corresponding theory curves.
    Fig. 3. For a single-layer sample (mirror): (a) and (c) experimental HOM dip for photon-pair source in configuration A (filtered), in panel (a), and for configuration B (unfiltered) in panel (c). The insets in panels (a) and (c) show the single-photon spectral distribution S(ω) measured at the single-mode fiber outputs. Both distributions are approximately rectangular in shape with bandwidths 10  nm and 50  nm, respectively. For the empty frame in the sample: (b) and (d) experimental QOCT interferogram for configuration A (filtered), in panel (b), and for configuration B (unfiltered) in panel (d). The continuous lines are corresponding theory curves.
    QOCT interferogram obtained for the sample when illuminating the empty frame (purple dots) and the frame containing the letter ψ imprinted (green dots).
    Fig. 4. QOCT interferogram obtained for the sample when illuminating the empty frame (purple dots) and the frame containing the letter ψ imprinted (green dots).
    For the frame with the letter ψ imprinted: (a) panels (i)–(vi) correspond to single-shot C-scans obtained for the axial positions indicated with dashed red lines in panel (b), with the insets showing the same measurement taken for the frame without the letter ψ. (b) QOCT interferogram obtained with the gated ICCD camera (summing up pixels) at each axial point of a single A-scan acquisition sequence (blue dots), and with two APD detectors as in Fig. 4 (green dots). (c) Same data as in (a) arranged as a stack, also including data for z=132 μm.
    Fig. 5. For the frame with the letter ψ imprinted: (a) panels (i)–(vi) correspond to single-shot C-scans obtained for the axial positions indicated with dashed red lines in panel (b), with the insets showing the same measurement taken for the frame without the letter ψ. (b) QOCT interferogram obtained with the gated ICCD camera (summing up pixels) at each axial point of a single A-scan acquisition sequence (blue dots), and with two APD detectors as in Fig. 4 (green dots). (c) Same data as in (a) arranged as a stack, also including data for z=132  μm.
    (a) Schematic representation of the sample with two regions, type-I and type-II, presenting different reflectivities: R1 and R1′ (R1′<R1) for the front surface and homogeneous reflectivity R2 for the back surface. (b) Calculated QOCT interferogram for type-I (green solid) and type-II (blue dashed) regions considering reflectivites, R1=0.45, R1′=0.2×R1, and R2=0.80. (c) Plots of the visibility contrast parameters, χ1 and χ2, for the front and back surfaces explaining the observed behavior in panels (ii) and (v) in Fig. 5(a).
    Fig. 6. (a) Schematic representation of the sample with two regions, type-I and type-II, presenting different reflectivities: R1 and R1 (R1<R1) for the front surface and homogeneous reflectivity R2 for the back surface. (b) Calculated QOCT interferogram for type-I (green solid) and type-II (blue dashed) regions considering reflectivites, R1=0.45, R1=0.2×R1, and R2=0.80. (c) Plots of the visibility contrast parameters, χ1 and χ2, for the front and back surfaces explaining the observed behavior in panels (ii) and (v) in Fig. 5(a).
    Zeferino Ibarra-Borja, Carlos Sevilla-Gutiérrez, Roberto Ramírez-Alarcón, Hector Cruz-Ramírez, Alfred B. U’Ren. Experimental demonstration of full-field quantum optical coherence tomography[J]. Photonics Research, 2020, 8(1): 51
    Download Citation