In order to overcome the existing disadvantages of offline laser shock peening detection methods, an online detection method based on acoustic wave signals energy is provided. During the laser shock peening, an acoustic emission sensor at a defined position is used to collect the acoustic wave signals that propagate in the air. The acoustic wave signal is sampled, stored, digitally filtered and analyzed by the online laser shock peening detection system. Then the system gets the acoustic wave signal energy to measure the quality of the laser shock peening by establishing the correspondence between the acoustic wave signal energy and the laser pulse energy. The surface residual stresses of the samples are measured by X-ray stress analysis instrument to verify the reliability. The results show that both the surface residual stress and acoustic wave signal energy are increased with the laser pulse energy, and their growth trends are consistent. Finally, the empirical formula between the surface residual stress and the acoustic wave signal energy is established by the cubic equation fitting, which will provide a theoretical basis for the real-time online detection of laser shock peening.
Laser shock peening (LSP) process is one of the surface treatments to induce residual compressive stress on the material surface to improve the fatigue property of material. Laser is irradiated on the metal surface under confinement layer such as glass or water to generate high pressure near material surface by laser ablation in LSP process1-3. The LSP utilizes the laser-induced plasma shock wave, and the shock wave pressure is increased through the constraining layer, which is formed by the principle structure of the absorption layer and the constraining layer. The principle structure is representative and has the characteristics of high pressure, high energy and super high strain rate4-6. The LSP utilizes the mechanical effects of the laser induced plasma shock wave rather than the thermal effect. Thus, it has no thermal influence on the samples during the machining process7. Compared with traditional surface hardening methods, it has the advantages of higher effect, stronger controllability and better applicability.
The surface residual stress of material is generally used to evaluate the degree of LSP process. The measurement of the surface residual stress is mainly carried out by offline methods such as the hole drilling strain method8 or the X-ray stress measurement9. But these methods are inefficient and unable to change the process in time. In order to achieve large-scale industrial application and actual production of LSP technology, it is necessary to develop non-destructive online detection technology of LSP10-12.
As we know, the propagation of plasma shock wave in metallic material causes high strain rate dynamic response of materials, which is the main reason for material hardening. In addition, the plasma shock wave propagates in the air, which decays into acoustic wave. The acoustic wave can comprehensively reflect the parameter variation characteristic during LSP. So the analysis and extraction of acoustic wave characteristics can be used for real-time online detection of the LSP process13-15.
In view of the existing disadvantages of offline LSP detection methods, the acoustic wave online detection of LSP is proposed in this paper. The TiAl alloy16-17 samples were selected as the test material, which were LSP treated with different laser pulse energies. The acoustic wave signal was sampled, stored, digitally filtered and analyzed by the online LSP detection system, which mainly contains acoustic emission sensor, preamplifier, data acquisition card and computer. Then the system gets the acoustic wave signal energy from these collected signals. And the Correspondence between acoustic wave signal energy and laser pulse energy is studied. After that, the X-ray stress analysis instrument is used to measure the surface residual stress of the shock treated samples. Finally, the empirical formula between the surface residual stress and the acoustic wave signal energy is established by the cubic equation fitting, which will provide a theoretical basis for the real time online detection of LSP.
Experimental methods
Material
The TiAl alloy cast ingot was prepared by vacuum consumable treatment twice and vacuum induction melted treatment once with the chemical compositions being Ti-45.5Al-2Cr-2Nb-0.15B (see Table 1 for details). The samples were further machined into dimensions of 30 mm×30 mm×3 mm. Prior the process of LSP, the intended LSP surfaces of specimens were grounded with 1200 grit sandpaper followed by final polishing to the surface roughness of 0.05 μm, and treated by stress relieving device with process parameters of 40 kHz, 50 μm and 5 min to eliminate stress of specimens' surface.
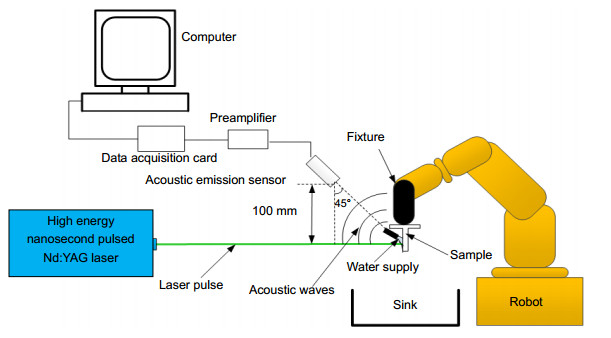
The schematic diagram of the experimental device is shown in Fig. 1, which consists of a LSP system and an acoustic wave detection system. The LSP system is independently developed by Shenyang Institute of Automation, Chinese Academy of Sciences, which includes of high energy nanosecond pulsed Nd:YAG laser18-19, robot20, water supply system, sink, fixture, sample and so on. The acoustic wave detection system includes acoustic emission sensor21, preamplifier22, data acquisition card23, and computer, etc.
Figure 1.Schematic diagram of experimental device.
The specific parameters of high energy nanosecond pulsed Nd:YAG laser are shown in Table 2. The laser beam travels through optical microscope, homogenized microscope and focusing lens and then irradiates onto a material surface as a circle laser beam spot.
Technical parameters
Value
Working substance
Nd:YAG
Laser wavelength (nm)
1064
Pulse energy (J)
1.0-7.0
Working frequency (Hz)
Single, 0.25, 0.5, 1, 2, 5
Laser pulse width (ns)
9-21
Energy distribution
Gaussian distribution
Spot shape
Circle
Spot diameter (mm)
1-5
Table 2. The main technical parameters of high energy nanosecond pulsed Nd: YAG laser.
PXR15 acoustic emission sensor with resonant frequency of 150 kHz is employed as the acoustic emission sensor. The preamplifier employed in this experiment is PXPA2 series acoustic emission low noise preamplifier with 40 dB fixed-gain. The data acquisition card is PXDAQ16172G network acoustic emission meter with 64 MB/s data throughput rate. As shown in Fig. 1, the acoustic emission sensor, preamplifier, and data acquisition card are connected in sequence by a low noise signal line, an acoaxial cable.
Experimental parameters
The laser parameters with a pulse of 14 ns, a frequency of 1 Hz, a spot diameter of 3 mm and the laser pulse energy of 5.0-7.0 J was used for this experiment. The laser intensity can be represented as the following equation:
where I0 is the laser pulse energy density, and E, D, τ are laser pulse energy, spot diameter and pulse width, respectively. In this experiment, the value of D is 3 mm, and the value of τ is 14 ns. The laser intensity of each associated laser pulse energy in this experiment is shown in Table 3.
Laser energy (J)
Laser intensity (GW/cm2)
5.0
5.05
5.4
5.46
5.8
5.86
6.2
6.27
6.6
6.67
7.0
7.08
Table 3. Laser intensity of each associated laser energy.
In the LSP experiment, the dark tape (thickness of 100 μm) was used as an ablative medium to protect the samples from thermal effects and deionized water (thickness of 2 mm) was used as confining medium. The track paths schematic of LSP are shown in Fig. 2 and the overlap ratio of laser beam spot is 50%.
Effect of LSP on surface residual stress of TiAl alloy
Figure 3 shows the surface residual stress of LSP region with different laser pulse energy. In LSP, the surface of TiAl alloy is shocked by high temperature and pressure peak shock wave, resulting in compressive residual stress on the surface of material. The surface compressive stresses are found to increase with the increasing of laser pulse energy. When the pulse energy is 5.0 J, the surface compressive residual stress is about -298 MPa, and when the pulse energy is increased to 7.0 J, the surface compressive residual stress is about -334 MPa.
Figure 3.Effect of laser pulse energy on surface residual stress.
Figure 4 shows the acoustic wave signal energy of LSP region with different laser pulse energy. The acoustic wave can reflect the parameter variation characteristic comprehensively during LSP. And the acoustic wave signal energy is one of the most important parameters of acoustic wave. Therefore, the acoustic wave signal energy can be used to characterize the acoustic wave. The acoustic wave signal energy is found to increase with the increasing of laser pulse energy. When the pulse energy increased from 5.0 J to 7.0 J, the acoustic wave signal energy increased from 0.730 V.s to 0.937 V.s.
Figure 4.Effect of laser pulse energy on acoustic wave signal energy.
According to the present research, we can conclude that the surface compressive residual stress and the acoustic wave signal energy increased similarly as the laser pulse energy increases from 5.0 J to 7.0 J, which will provides a direction for the online detection technology of LSP. It also shows that the method of the LSP detection in this paper is reliable.
The principle of LSP indicates that the laser induced plasma shock wave is the direct inducing factor of the plastic deformation of the material, which determines the surface strengthening quality of the metal materials. So the quality of LSP can be acquired by measuring the laser induced plasma shock wave parameters24. The available theory of the shock wave induced by laser-plasma in air is Taylor15, 25-27 equation:
$
R = {\left( {k\frac{{{E_0}}}{{{\rho _0}}}} \right)^{1/5}}{t^{2/5}},
$
where D is shock wave velocity, R is the radius of the shock wave front, E0 is the energy of the shock wave, ρ0 is the density of the ambient gas, t is the time of the shock wave propagating to the radius, k is the integral constant of the explosion, which is close to 1. The shock wave in air is also called plasma acoustic wave. In this work, both of the value of R and ρ0 are determined. So D is positively related to E0. And E0 is determined by the laser power density or laser pulse energy, and they have a definite relationship.
According to the high shock wave relation15, 26-27:
where p is the pressure of the plasma acoustic wave or shock wave, γ is specific heat ratio, u0 is the velocity of the shock wave front, which is 0 in this work. So the p is proportional to the square of the D. In addition, the surface residual stress of material on LSP region is determined by the laser power density or laser pulse energy, and they have a definite relationship. Thus, the analysis and extraction of plasma acoustic wave characteristics can be used for real-time online detection of the LSP process.
The relationship between the surface residual stress and acoustic wave signal energy is yielded in Fig. 5, and it is applicable for the laser pulse energy of 5.0-7.0 J. After the cubic equation fitting to Fig. 5, the empirical formula of the surface residual stress and acoustic wave signal energy is established as
The LSP was quantitatively evaluated by the method of the LSP detection in this work. Both the surface residual stress and the acoustic wave signal energy increased similarly as the laser pulse energy increased from 5.0 J to 7.0 J. The empirical formula between the surface residual stress and the acoustic wave signal energy is established by the cubic equation fitting, which will provide a theoretical basis for the real-time online detection of LSP.
Acknowledgements
This study was co-supported by National Natural Science Foundation of China (51501219), National Key Development Program of China (2016YFB1192704), NSFC-Liaoning Province United Foundation (U1608259) and National Key Technology Research and Development Program of the Ministry of Science and Technology of China (2015BAF08B01-01).
Competing interests
The authors declare no competing financial interests.
[15] LiY HTheory and Technology of Laser Shock Processing (Science Press, Beijing, 2013)Li Y H. Theory and Technology of Laser Shock Processing (Science Press, Beijing, 2013).
[22] C Mekchar, W Wongsuwan, W Srichavengsup, W San-Um. The implementation of cost-effective data acquisition system for acoustic emission sensor using variable gain preamplifier and STM32F4 microcontroller interface. TNI J Eng Technol, 2, 18-22(2014).