• Laser & Optoelectronics Progress
  • Vol. 56, Issue 19, 193002 (2019)
Jian Huang1、**, Jingqi Lu1、*, Huan Yang2, and Xiangdong Cao2
Author Affiliations
  • 1Department of Physics, College of Science of Wuhan University of Technology, Wuhan, Hubei 430070, China
  • 2Wuhan Hongtuo New Technology Co., Ltd., Wuhan, Hubei 430070, China
  • show less
    DOI: 10.3788/LOP56.193002 Cite this Article Set citation alerts
    Jian Huang, Jingqi Lu, Huan Yang, Xiangdong Cao. Quantitative Analysis on Coal Calorific Value Using Nanosecond, Femtosecond, and Dual-Pulse Laser-Induced Breakdown Spectroscopy[J]. Laser & Optoelectronics Progress, 2019, 56(19): 193002 Copy Citation Text show less
    Structural diagram of single pulse LIBS setup
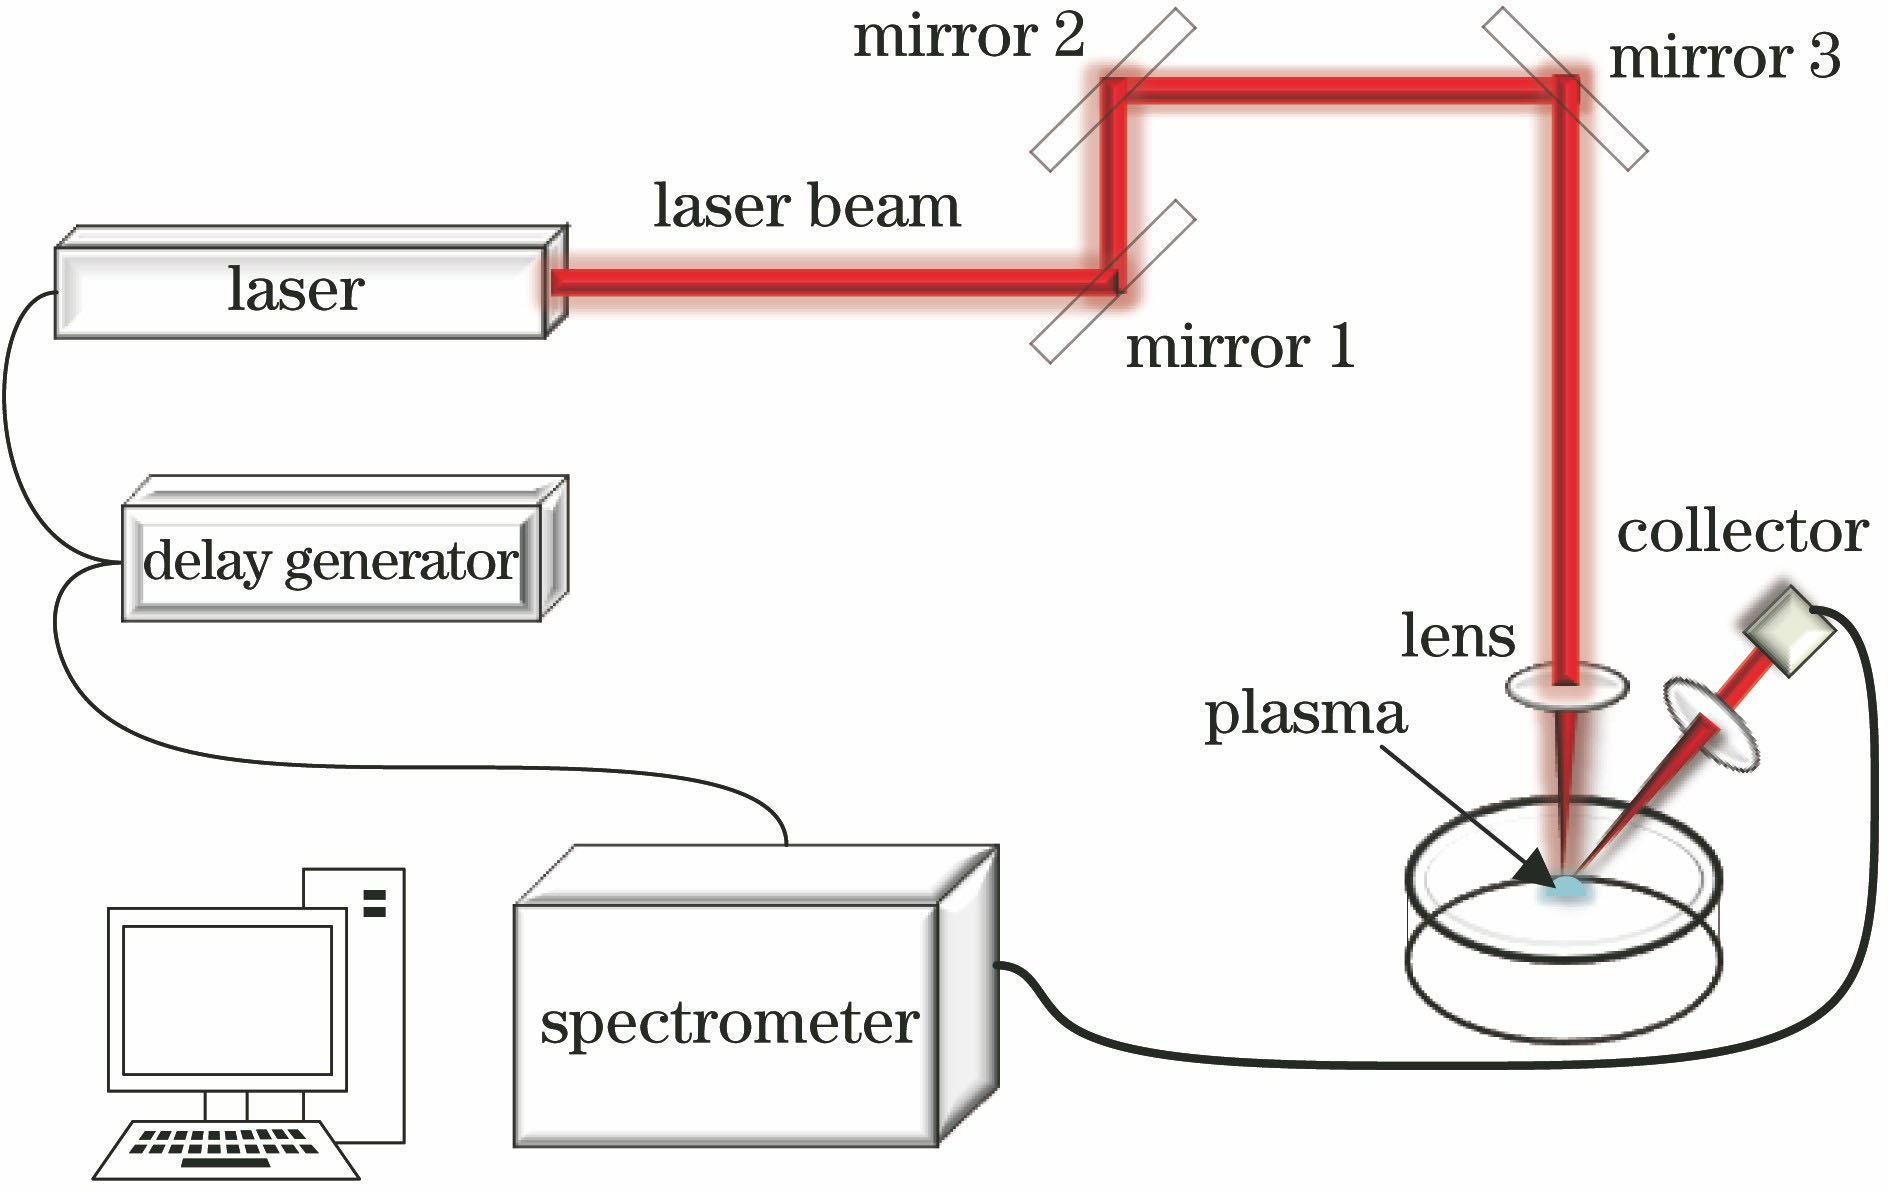
    Fig. 1. Structural diagram of single pulse LIBS setup
    Structural diagram of double pulse LIBS setup
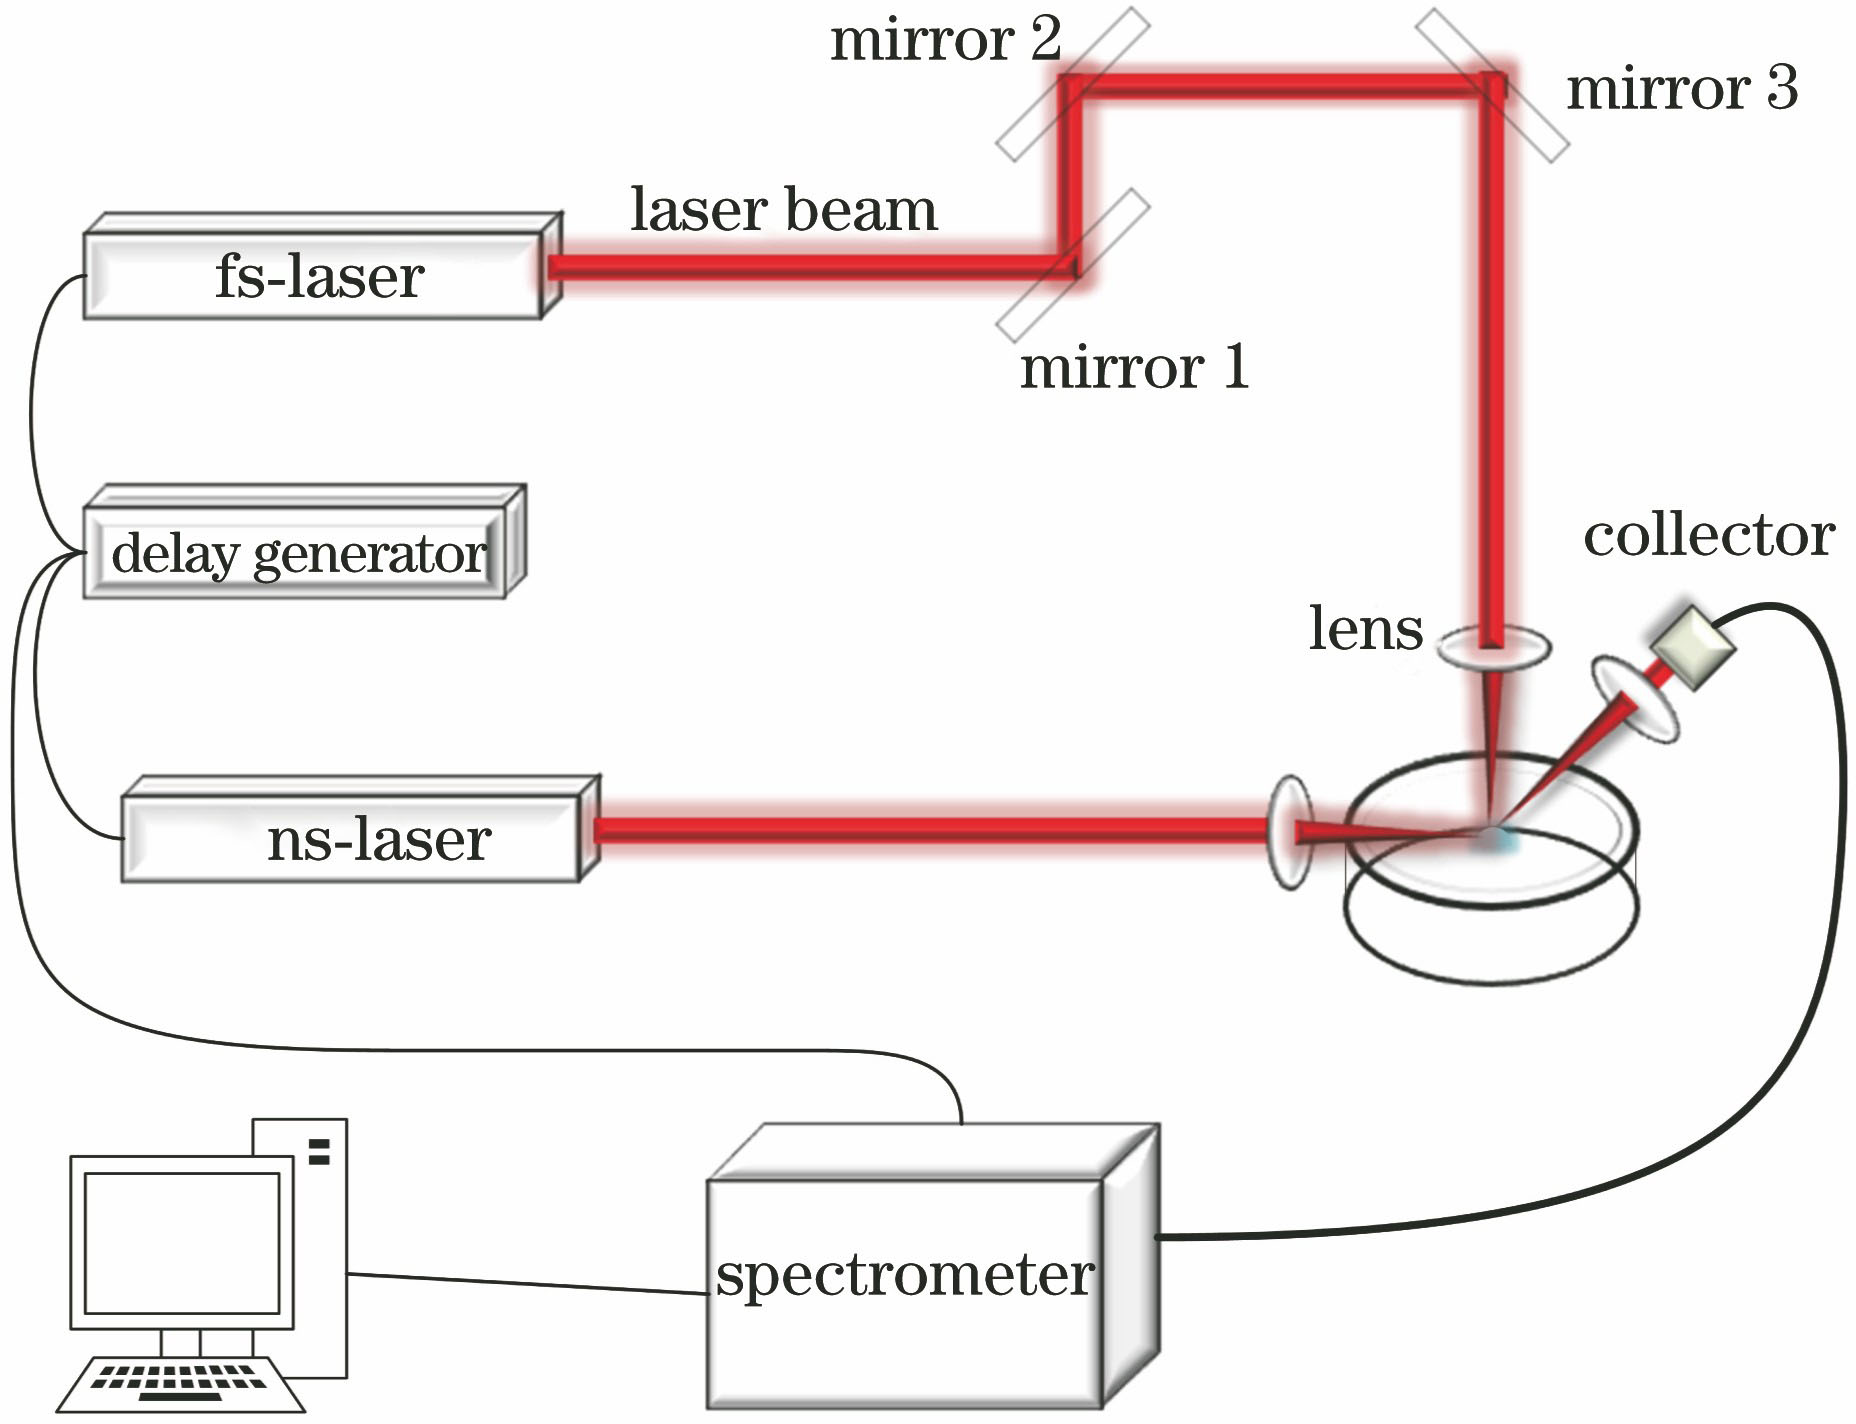
    Fig. 2. Structural diagram of double pulse LIBS setup
    Spectrograms of coal samples. (a) ns-LIBS; (b) fs-LIBS
    Fig. 3. Spectrograms of coal samples. (a) ns-LIBS; (b) fs-LIBS
    Scatter plot of normalized emission intensity of C
    Fig. 4. Scatter plot of normalized emission intensity of C
    Linear fitting of C content. (a) ns-LIBS; (b) ns-LIBS after correction; (c) fs-LIBS
    Fig. 5. Linear fitting of C content. (a) ns-LIBS; (b) ns-LIBS after correction; (c) fs-LIBS
    Femtosecond laser and dual-pulse laser induced spectrogram
    Fig. 6. Femtosecond laser and dual-pulse laser induced spectrogram
    Predicted calorific value by PLS. (a) ns-LIBS; (b) fs-LIBS; (c) DP-LIBS
    Fig. 7. Predicted calorific value by PLS. (a) ns-LIBS; (b) fs-LIBS; (c) DP-LIBS
    Sample No.Mass fractionof C /%Calorific value /(MJ·kg-1)Sample No.Mass fractionof C /%Calorific value /(MJ·kg-1)
    179.7031.231057.8222.45
    276.2130.001156.1521.64
    381.4431.741218.437.60
    478.0830.28135.802.28
    581.4531.861478.3031.29
    678.5832.601582.3032.16
    779.6031.501679.7731.09
    849.3019.421776.5729.90
    967.0826.951880.7931.50
    Table 1. Carbon mass fraction and calorific value of standard coal samples
    ElementEmission line /nmInput emission /nmElementEmission line /nmInput emission /nm
    C247.84247.65-248.15Si288.13288.02-285.54
    Mg285.17285.00-285.52Al309.27309.00-309.50
    Ti334.92334.80-335.10Fe393.36393.03-393.56
    CN388.28387.44-388.48Ca422.69422.42-422.90
    C2516.37516.21-516.73Na589.72589.52-589.91
    H656.22653.00-659.78O777.34776.47-777.88
    Table 2. Emission line of input parameter for quantitative analysis based on PLS
    Jian Huang, Jingqi Lu, Huan Yang, Xiangdong Cao. Quantitative Analysis on Coal Calorific Value Using Nanosecond, Femtosecond, and Dual-Pulse Laser-Induced Breakdown Spectroscopy[J]. Laser & Optoelectronics Progress, 2019, 56(19): 193002
    Download Citation