Author Affiliations
11. State Key Laboratory of High Performance Ceramics and Superfine Microstructure, Shanghai Institute of Ceramics, Chinese Academy of Sciences, Shanghai 200050, China22. School of Physical Science and Technology, ShanghaiTech University, Shanghai 200031, China33. State Key Laboratory of Rare Earth Materials Chemistry and Applications, College of Chemistry and Molecular Engineering, Peking University, Beijing 100871, Chinashow less
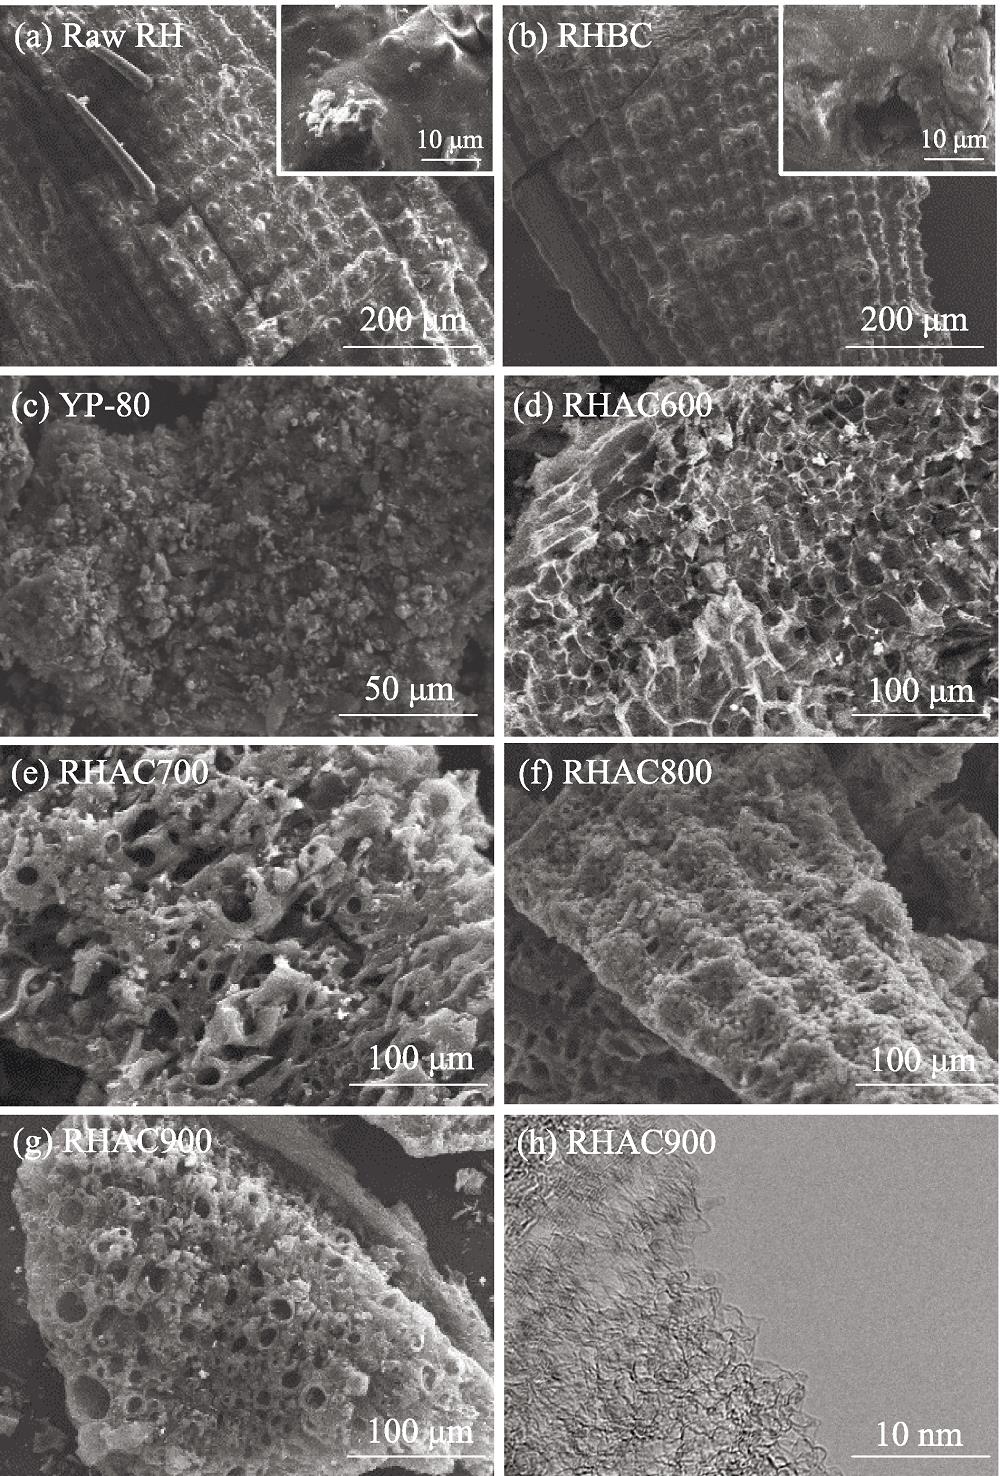
1. SEM images of (a) raw RHs, (b) RHBC, (c) YP-80, (d) RHAC600, (e) RHAC700, (d) RHAC800; SEM (g), and TEM (h) images of RHAC900
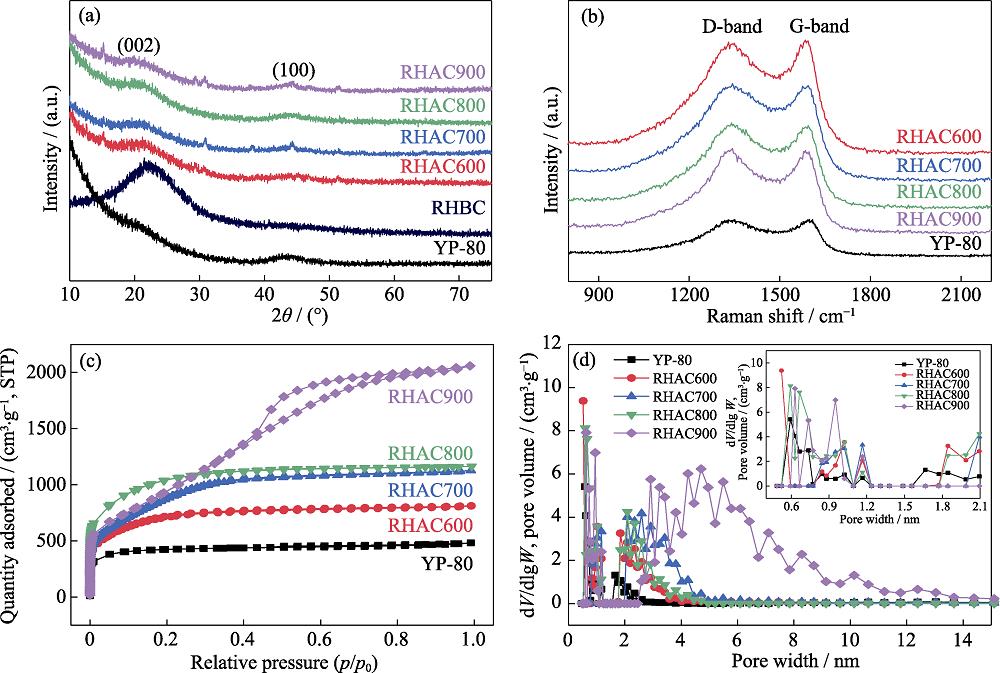
2. (a) XRD patterns, (b) Raman spectra, (c) N2 adsorption-desorption isotherms and (d) pore size distribution curves of RHBC, RHACs and YP-80
3. Effects of contact time and mass of adsorbent on the adsorption capacity
4. Linear fits of the pseudo-second-order models for the adsorption of MB on (a) YP-80, (b) RHAC600, (c) RHAC700, (d) RHAC800, (e) RHAC900, and (f) corresponding correlation coefficients
S1. XRD patterns of the product calcined from RHs and RHBC
S2. (a) XRD patterns of dried RHBC mixture impregnated with two different concentrations of KOH solution; (b) Nitrogen adsorption desorption curves of two RHAC with different concentrations of KOH solution
S3. Linear fits of the pseudo-first-order models for five carbons: (a) YP-80, (b) RHAC600,(c) RHAC700, (d) RHAC800, (e) RHAC900 and (f) correlation coefficients
S4. Photos of RH, RHBC, RHAC600, RHAC700, RHAC800 and RHAC900 before and after calcination
S5. FT-IR spectra of RHAC before and after MB adsorption
Biomass | Activator | Pore volume/(cm3•g-1)
| SSABET/(m2•g-1)
| qm/(mg•g-1)
|
---|
Tobacco stalks[1] | ZnCl2+Microwave
| 0.45 | 684.68 | 123.45 | Dipterocarpus alatus[2] | ZnCl2/500 ℃
| 0.473 | 843 | 269.3 | Sugar beet pulp[3] | H3PO4/450 ℃
| 0.445 | 1029.3 | 250.0 | Palm kernel shell[4] | ZnCl2/550 ℃
| 0.571 | 1058 | 225.3 | Rice by-products[5] | H3PO4/450 ℃
| 0.612/0.607 | 814/1000 | 246.9/213.7 | Viscose fibers[6] | Steam/900 ℃ | 0.54/0.76 | 1284/1614 | 256.1/325.8 | Cotton[7] | H3PO4+Microwave
| 0.98 | 1370 | 476.2 | Cashew nut shell[8] | ZnCl2/400 ℃
| 0.973 | 1478 | 476 | Arundo donax[9] | ZnCl2/400 ℃
| 1.113 | 1784 | 416.7 | Sawdust[10] | KOH/1000 ℃ | 1.27 | 2254 | 303.03 | Bamboo shoots[11] | KHCO3/700 ℃/800 ℃
| 0.73/1.25 | 1476/2271 | 458 | Bagasse/Cluster stalks[12] | KOH/1300 ℃ | 0.82/1.4 | 1861/2662 | 714.3/925.9 | This work | KOH/800 ℃/900 ℃ | 1.829/3.164 | 3366/3600 | 919/983 |
|
Table 1. Comparison of activator, SSABET, total pore volume and qm (the maximum adsorption of MB) between RHACs and other AC prepared from biomass
Carbon | YP-80 | RHAC600 | RHAC700 | RHAC800 | RHAC900 |
---|
ID: IG | 0.997 | 0.992 | 1.017 | 1.025 | 1.020 | SSABET/(m2•g-1)
| 1310 | 2380 | 3173 | 3366 | 3600 | Pore volumetotal/(cm3•g-1)
| 0.816 | 1.352 | 1.733 | 1.829 | 3.164 | Micropore volume/(cm3•g-1)
| 0.516 | 0.393 | 0.429 | 0.606 | 0.537 | Adsorption limit/(mg•g-1)
| 525 | 851 | 935 | 919 | 983 |
|
Table 1. The ratio of ID to IG, SSABET, pore volumestotal, micropore volumes and adsorption limits of RHACs and YP-80
Sample | qe(exp)/(mg•g-1)
| q1(cal)/(mg•g-1)
| Percentual difference, (qe-q1)/%
| k1/min-1 |
---|
YP-80 | 525 | 19.8 | 96.23 | 0.0192 | RHAC600 | 851 | 438.8 | 48.44 | 0.0614 | RHAC700 | 935 | 85.9 | 90.81 | 0.0231 | RHAC800 | 919 | 259 | 71.82 | 0.0433 | RHAC900 | 983 | 89 | 90.95 | 0.0347 |
|
Table 2. Kinetic parameters obtained by the pseudo-first-order model for RHACs and YP-80 for the adsorption of MB
Sample | qe (exp)/
(mg•g-1)
| q2(cal)/
(mg•g-1)
| Percentual difference (qe-q2)/%
| k2/(g•mg-1•min-1)
|
---|
YP-80 | 525 | 526.3 | -0.25 | 0.0090 | RHAC600 | 851 | 833.3 | 2.08 | 0.0006 | RHAC700 | 935 | 833.3 | 10.88 | 0.0018 | RHAC800 | 919 | 909.1 | 1.08 | 0.0007 | RHAC900 | 983 | 1000 | -1.73 | 0.0025 |
|
Table 2. Kinetic parameters obtained of RHACs and YP-80 by the pseudo-second-order model for the adsorption of MB
| RHBC | RHAC600 | RHAC700 | RHAC800 | RHAC900 |
---|
C | 19.48 | 95.18 | 97.21 | 94.16 | 95.63 | O | 35.59 | 4.82 | 2.79 | 3.15 | 2.28 | Si | 40.73 | 0 | 0 | 0 | 0 | Ca | 0.1 | 0 | 0 | 0 | 0 |
|
Table 3. Element analysis of RHBC, RHAC600, RHAC700, RHAC800 and RHAC900 by EDS/wt%
| RH | RHBC | RHAC600 | RHAC700 | RHAC800 | RHAC900 |
---|
Before/mg | 2502.0 | 1002.4 | 148.1 | 76.3 | 88.7 | 53.9 | After/mg | 375.0 | 330.0 | 0 | 0 | 0 | 0 | Ash content/% | 14.99 | 32.92 | — | — | — | — |
|
Table 4. Mass and ash content of RH, RHBC, RHAC600, RHAC700, RHAC800 and RHAC900 before and after calcination