• Journal of Inorganic Materials
  • Vol. 36, Issue 8, 893 (2020)
Fan ZHOU1、2, Hui BI1, and Fuqiang HUANG1、2、3、*
Author Affiliations
  • 11. State Key Laboratory of High Performance Ceramics and Superfine Microstructure, Shanghai Institute of Ceramics, Chinese Academy of Sciences, Shanghai 200050, China
  • 22. School of Physical Science and Technology, ShanghaiTech University, Shanghai 200031, China
  • 33. State Key Laboratory of Rare Earth Materials Chemistry and Applications, College of Chemistry and Molecular Engineering, Peking University, Beijing 100871, China
  • show less
    DOI: 10.15541/jim20200632 Cite this Article
    Fan ZHOU, Hui BI, Fuqiang HUANG. Ultra-large Specific Surface Area Activated Carbon Synthesized from Rice Husk with High Adsorption Capacity for Methylene Blue[J]. Journal of Inorganic Materials, 2020, 36(8): 893 Copy Citation Text show less

    Abstract

    Activated carbon with high surface area and abundant pore structure is widely used for contaminant adsorption in wastewater treatment. Rice husks (RHs) with unique composition and microstructure are often used as carbon source to prepare activated carbon. Herein, ultra-large specific surface area activated carbon was synthesized from rice husks with pre-activation and activation by supersaturated KOH solution at different temperatures. With the increase of activation temperature, the specific surface area and total pore volume of activated carbon gradually increase. The activated carbon obtained at 900 ℃ shows the largest specific surface area of 3600 m2/g and the maximal total pore volume of 3.164 cm3/g, which are significantly superior to those of the commercial activated carbon (YP-80, the specific surface area of 1310 m2/g and the total pore volume of 0.816 cm3/g, respectively). The highest maximum adsorption capacity for methylene blue was found for the activated carbon with the largest specific surface area, namely, 983 mg/g, which is almost twice as high as that of YP-80 (525 mg/g). By adsorption kinetics fitting, the results are consistent with pseudo-second-order model which indicates that the process of adsorbing methylene blue is chemical adsorption.

    Activated carbon (AC) has been always appealing to researchers’ attention due to its excellent properties and versatility. Relying on their low-cost stocks, large specific surface area (SSABET), abundant pore structure, high chemical stability and non-toxicity, AC has been widely applied to treat waste water containing methylene blue (MB)[1]. The MB is commonly utilized for hair colorant, textile dyeing, coloring paper and so on[2]. Because of carcinogenesis effect, the amount of MB in the body is large enough to cause cancer, mutation and dermatological diseases[3]. Therefore, removing MB from waste water is significantly important.

    The synthesis methods of AC include physical and chemical activation with microwave heating assisting occasionally. Various agricultural wastes are used as raw materials, such as peanut hull[4], tea-leaves[5], cotton[6], coconut husks[7]. CO2 and water vapor are applied as activating agents in physical activation[8,9]. ZnCl2, KOH and H3PO4 are usually utilized as activator in chemical activation[10,11,12]. Bellington, et al.[13] utilized ZnCl2 to activate tobacco stems with microwave heating, and the product got the SSABET of 684.68 m2/g and the maximum adsorption capacity of 123.45 mg/g for adsorbing MB. Viscose-based AC fibers were prepared by steam with different flows at 900 ℃ for the adsorption of MB, and they performed the SSABET of 1614 m2/g and the adsorption capacity of 325.8 mg/g[9]. Bamboo shoots were activated by KHCO3 to prepare AC for removing MB from waste water, which exhibited the SSABET of 2271 m2/g and the maximum adsorption capacities of 458 mg/g[14]. Obviously, the SSABET of AC has an essential impact on the adsorption capacity for MB. Therefore, there exists a great challenge to find a certain kind raw material or method for the preparation of AC with larger SSABET.

    As an abundant agricultural bio-waste, RHs which hollow fibers are assembled by cellulose, hemicellulose, lignin and significant amounts of SiO2 of about 20wt% have great potential to prepare AC with ultra-high SSABET owning to their natural structure and component[15]. Most of SiO2 and spacious carbon skeleton exist in the outer glume of RHs. The inner glume of RHs is composed of a large number of bundles of vascular tubes to transport nutrients[16]. SiO2 as a hard template can react with molten alkali in the activation process to provide some pore structure. In the subsequent activation, pores formed are further broadened in the original SiO2 sites. It has also been reported that NaOH can be used as activator to prepare AC showing relatively large SSABETof 1873 m2/g based on RHs[17].

    In this study, supersaturated KOH solution was adopted to prepare AC with ultra-large SSABET based on the unique advantages of RHs. MB adsorption experiment on the RHAC was conducted to explore the influence of temperature on the SSABET and the adsorption capacity. The SSABET, pore structure, and adsorption capacity of RHACs were compared with other AC materials made from other agricultural bio-waste such as tobacco stalk, viscose fibers and sawdust.

    1 Experimental

    1.1 Materials and synthesis

    The raw RHs were bought from the Taobao network. The received RHs were washed with the deionized water to eliminate the impurities. Then, they were put into drying oven at 60 ℃ for 24 h. Potassium hydroxide (AR, 90%) was purchased from the Aladdin. Methylene Blue trihydrate (biotechnology grade) was bought from the Shanghai Macklin Biochemical Co., Ltd. Hydrochloric acid (AR) and hydrofluoric acid (AR) were purchased from the Shanghai Hushi Laboratorial Equipment Co., Ltd.

    The raw RHs were pyrolyzed at 400 ℃ in the argon atmosphere for 1 h in the horizontal tubular furnace to obtain RH biochar (RHBC). RHBC (4 g) and KOH solution (2 mol/L, 107 mL) were mixed and stirred for 30 min. The mixture was put into a drying oven at 100 ℃ for 48 h to remove water. The dry mixture was heat-treated in the horizontal tubular furnace in the argon atmosphere for 2 h at 700 ℃ to produce RHAC1. RHBC (4 g), KOH (12 g) and 25 mL deionized water are used to produce RHAC2 and the preparation method is the same as that of RHAC1.

    RHBC (8 g), KOH (32 g) and 50 mL deionized water were mixed and stirred for 30 min. The mixture was put into a drying oven at 100 ℃ for 48 h to remove water. The dry mixture was heat-treated in the horizontal tubular furnace in the argon atmosphere for 2 h under 600, 700, 800 and 900 ℃ at heating rate of 13 ℃/min to produce RHAC600, RHAC700, RHAC800 and RHAC900, respectively. The impurities including alkalis, alkali oxides and silica in products were removed by HCl and HF mixture solutions for 48 h. Finally, all of RHAC were washed with the deionized water and dried in an oven at 120 ℃ for 12 h.

    1.2 Characterizations

    Surface morphology was investigated by scanning electron microscope (SEM-JMS-6510). Highly resolution transmission electron microscope (HRTEM) images were conducted on JEOL 2100F. The crystalline structure was carried on Bruker D8 X-ray diffractometer with the source of Cu Kα radiation at 40 kV and 40 mA. Raman spectra was measured on a thermal dispersive spectrometer using a 10 mW laser (532 nm). Nitrogen adsorption- desorption isotherm was measured on a Micromeritics Tristar 3000 system at 77 K. The SSABET was obtained by the Brunauer-Emmett-Teller (BET) method and the pore size distribution was gained from Nonlocal Density Functional Theory (NLDFT).

    1.3 Adsorption experiments and kinetic studies

    MB solution with concentration of 500 mg/L was prepared for adsorption experiments in advance. The commercial AC (YP-80) was utilized as a control group. AC(100 mg)and MB solution(100 mL) were added into the beaker and magnetically stirred at room temperature (~25 ℃). The sampling intervals were 2, 4, 6, 8, 10, 15, 20, 25, 30, 45, 60, 90, 120 and 180 min. After highly speed centrifugation, the supernatant was extracted for analyzing its absorbance on the UV-visible spectrometer (Hitachi U4100) equipped with an integrating sphere. All tests were conducted at a specific wavelength, namely, the maximum absorbance (664 nm) of MB at room temperature. The correlation between absorbance and the MB concentration is determined according to the Lambert-Beer's Law[18]. Afterwards, the amount of each carbon addition dwindled gradually until the adsorption limit appeared.

    Adsorption capacity (qe) at equilibrium was calculated by the Equation (1)[19]:

    ${{q}_{\text{e}}}=\frac{({{C}_{\text{0}}}-{{C}_{\text{e}}})\text{V}}{m}$

    where qe (mg/g) is the adsorption capacity of MB at equilibrium, C0 (mg/L) is the primitive concentration of the MB solution (500 mg/L), Ce (mg/L) is the equilibrium concentration of the MB solution, V (L) is the MB solution volume i.e. 0.1 L, m (g) is the mass of added RHAC.

    The pseudo-first-order models (Equation (2)) and the pseudo-second order models (Equation (3)) were utilized to fit the adsorption data for describing the adsorption equilibrium[20]:

    ${{q}_{t}}={{q}_{\text{e}}}(1-{{\text{e}}^{-{{k}_{1}}t}})$
    ${{q}_{t}}=\frac{q_{\text{e}}^{2}{{k}_{2}}t}{1+{{k}_{2}}{{q}_{\text{e}}}t}$

    where qt (mg/g) is the adsorption capacity at time t, qe (mg/g) is the adsorption capacity of MB at equilibrium, k1and k2 are the rate constant of the pseudo-first-order (min-1) and the pseudo-second-order (min-1), respectively, t (min) is the adsorption time.

    2 Results and discussion

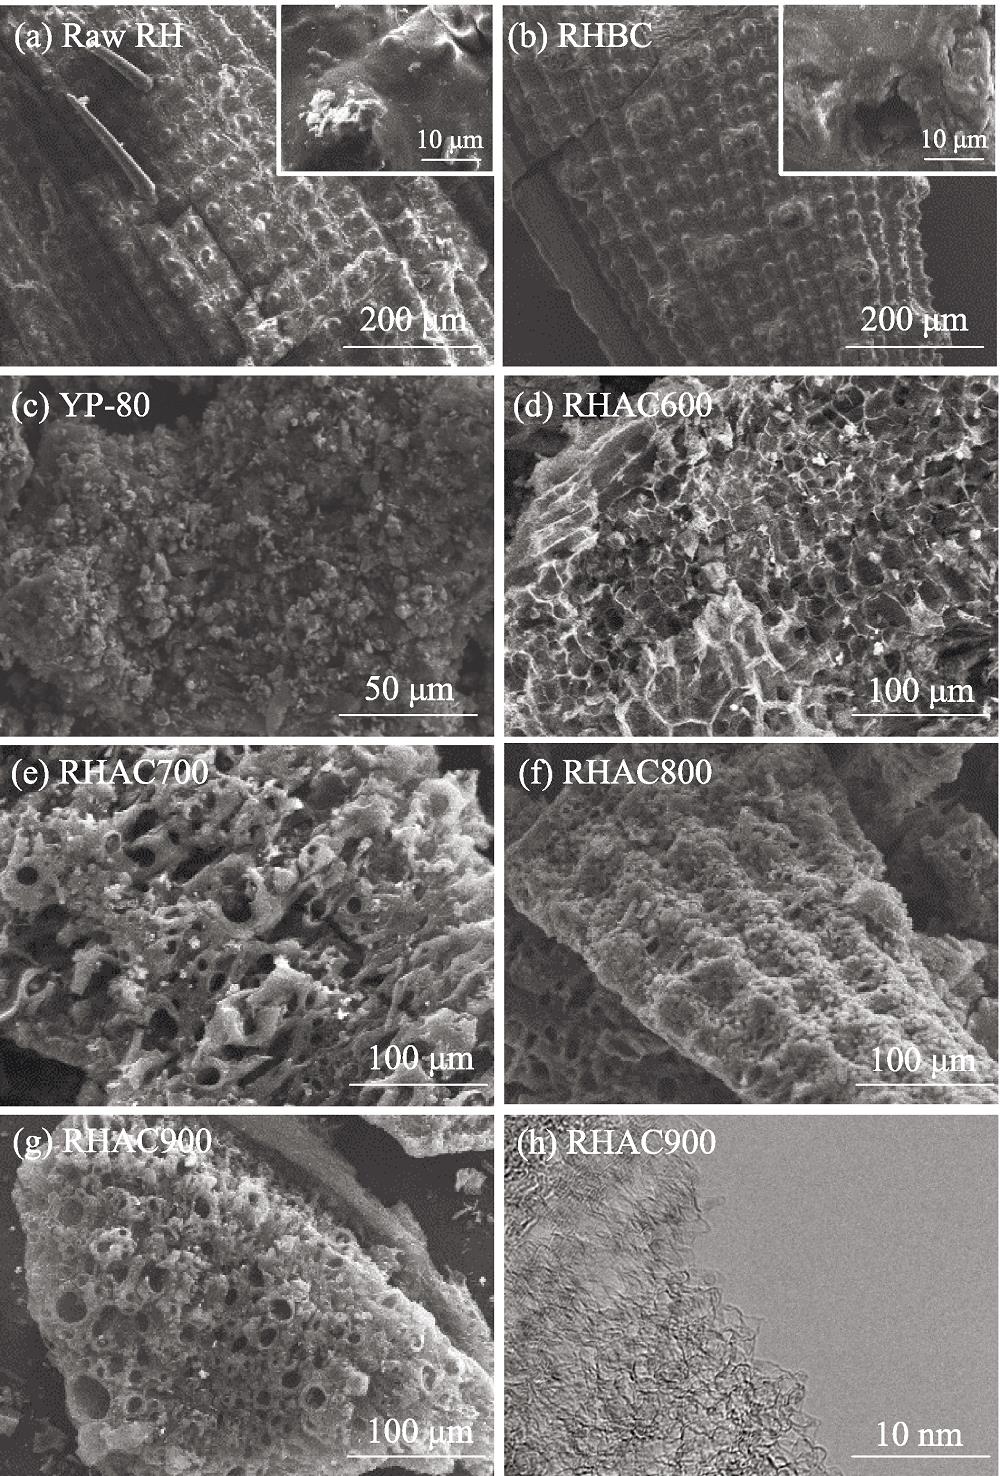
    The morphologies of raw RHs, RHBC and RHACs were characterized by SEM. Obviously, there are many humps on the outer glume of raw RHs and RHBC (Fig. 1(a,b)). The surface of humps in RHs is intact. After heat-treated at 400 ℃, lots of large opening pores appear on the surface of RHBC to conduce to activator-KOH enter the interior of RHBC for enhancing the process of activation[1]. The commercial AC (YP-80) shows fine granular blocks, and the visible pores are hard to find out (Fig. 1(c)). After activation, the abundant pore structure forms on the sample surface, which can provide adsorption sites and mass transfer channels in favor of adsorption application (Fig. 1(d-g))[9]. The inner side of RHs is activated to form spongy structure, and the outer surface of RHs forms honeycomb structure due to natural composition and structure of RHs (Fig. 1(d, e))[16]. With the activation temperature increasing, the process of forming pores is strengthened resulting in that the pore structure of RHAC900 is more abundant than that of RHAC800 (Fig. 1(f, g)). The porous structure was further examined by HRTEM. The RHAC900 mainly consists of amorphous carbon and plenty of vermicular micropores, in which a few graphitized carbon layers exist.

    SEM images of (a) raw RHs, (b) RHBC, (c) YP-80, (d) RHAC600, (e) RHAC700, (d) RHAC800; SEM (g), and TEM (h) images of RHAC900

    Figure 1.SEM images of (a) raw RHs, (b) RHBC, (c) YP-80, (d) RHAC600, (e) RHAC700, (d) RHAC800; SEM (g), and TEM (h) images of RHAC900

    As shown in Fig. 2(a), the inapparent peaks appear at around 2θ=23° and 44° suggesting that RHACs and YP-80 are composed of amorphous carbon[21]. Broad peak around 2θ=22° in RHBC indicates the overlapping peaks of carbon and silica, and the decrease of peak intensity suggests that SiO2 is almost completely removed (Fig. S1). Lignin and cellulose in precursors undergo a pyrolysis process at 400 ℃, in which the tar is formed from highly active polymer materials and releases, leaving inert carbon skeleton and amorphous SiO2, which shows strong but wide peak at around 2θ=22° (Fig. 2(a)). In the process of activation at high temperature, the amorphous nano-SiO2 was melted in the presence of KOH and eliminated at last, weakening the intensity of peaks at around 2θ=22°[15].

    (a) XRD patterns, (b) Raman spectra, (c) N2 adsorption-desorption isotherms and (d) pore size distribution curves of RHBC, RHACs and YP-80

    Figure 2.(a) XRD patterns, (b) Raman spectra, (c) N2 adsorption-desorption isotherms and (d) pore size distribution curves of RHBC, RHACs and YP-80

    XRD patterns of the product calcined from RHs and RHBC

    Figure S1.XRD patterns of the product calcined from RHs and RHBC

    Meanwhile, a part of carbon in RHBC reacts with KOH to produce CO and CO2 gases, resulting in abundant pores formation and the increasement of the degree of disorder in RHACs[22].

    Raman spectra of the RHACs and YP-80 contains D-band (1342-1352 cm-1), G-band (1590-1600 cm-1) (Fig. 2(b)). Normally, the graphitization degree of carbon increases gradually with the increase of the heat- treatment temperature[23]. However, with the activation temperature increasing, the ratio of D-band to G-band increases slightly (Table 1), resulting from that the disorder degree due to consuming carbon during activation has larger influence on the crystallinity of products than temperature[24].

    BiomassActivatorPore volume/(cm3•g-1) SSABET/(m2•g-1) qm/(mg•g-1)
    Tobacco stalks[1]ZnCl2+Microwave 0.45684.68123.45
    Dipterocarpus alatus[2]ZnCl2/500 ℃ 0.473843269.3
    Sugar beet pulp[3]H3PO4/450 ℃ 0.4451029.3250.0
    Palm kernel shell[4]ZnCl2/550 ℃ 0.5711058225.3
    Rice by-products[5]H3PO4/450 ℃ 0.612/0.607814/1000246.9/213.7
    Viscose fibers[6]Steam/900 ℃0.54/0.761284/1614256.1/325.8
    Cotton[7]H3PO4+Microwave 0.981370476.2
    Cashew nut shell[8]ZnCl2/400 ℃ 0.9731478476
    Arundo donax[9]ZnCl2/400 ℃ 1.1131784416.7
    Sawdust[10]KOH/1000 ℃1.272254303.03
    Bamboo shoots[11]KHCO3/700 ℃/800 ℃ 0.73/1.251476/2271458
    Bagasse/Cluster stalks[12]KOH/1300 ℃0.82/1.41861/2662714.3/925.9
    This workKOH/800 ℃/900 ℃1.829/3.1643366/3600919/983

    Table 1.

    Comparison of activator, SSABET, total pore volume and qm (the maximum adsorption of MB) between RHACs and other AC prepared from biomass

    The SSABET of RHACs was characterized by BET test, as shown in Fig. 2(c). There exists two types of N2 adsorption-desorption isotherm curves, type-Ⅰ for YP-80, RHAC600, RHAC700, RHAC800 and type-Ⅳ for RHAC900. The curves of type-Ⅰ conform to Langmuir's monolayer adsorption model indicating that the pore structure is mainly composed of micropores, and the obvious hysteresis loop in the type-Ⅳ curve for RHAC900 shows that abundant mesopores exist in this material, well explaining why the total pore volume and the pore size distribution of RHAC900 are far greater than other porous materials (Table 1)[25]. The SSABET and the total pore volumes of RHACs are positively correlated with activation temperature, and reach the highest value of 3600 m 2/g and 3.164 cm3/g for RHAC900 (Table 1). Supersaturated KOH solution can react with SiO2 in RHBC to form K2SiO3 during the process of impregnation and dry, contributing to pre-activation (Fig. S2(a)). The formation of K2SiO3 makes the original vacancy of self-template SiO2 exposed and drives the activator into a deeper position to promote the activation process. Accordingly, the sample RHAC2 has larger SSABET than sample RHAC1 (Fig. S2(b)), and the sample RHAC900 has larger SSABET compared with ACs made from other biomass materials by traditional preparation methods (Table S1). Although RHACs mainly contain micropores, there are still a small number of mesopores in these materials (Table 1). The mesopore size in RHAC600 ranges from 2 nm to 4 nm, tightly close to the range of micropore[12]. With the activation temperature increasing, more carbon in RHBC reacted with molten KOH, and the pore-forming process strengthened intensely, causing the size of pores to widen[15, 24]. Therefore, the mesopore size in RHAC900 enlarges from 2.5 nm to 14 nm. The SSABET and meso- pore size of RHACs are superior to YP-80 (Table 1). In the range of micropore size, the peak intensities of micropore distribution curves of RHACs are stronger than those of YP-80. Although the micropore volume of YP-80 is slightly higher than those of RHAC600 and RHAC700, the micropore volumes of RHAC800 and RHAC900 are higher than that of YP-80 and the total pore volume of RHACs are much larger (Table 1). The above characterization results reveal that the activation temperature has tremendous impact on the activation process and pore structure of RHACs. As the temperature increasing, the activation process becomes more violent, and more carbon is consumed, leading to the increasement of mesoporous content and size.

    (a) XRD patterns of dried RHBC mixture impregnated with two different concentrations of KOH solution; (b) Nitrogen adsorption desorption curves of two RHAC with different concentrations of KOH solution

    Figure S2.(a) XRD patterns of dried RHBC mixture impregnated with two different concentrations of KOH solution; (b) Nitrogen adsorption desorption curves of two RHAC with different concentrations of KOH solution

    RHBCRHAC600RHAC700RHAC800RHAC900
    C19.4895.1897.2194.1695.63
    O35.594.822.793.152.28
    Si40.730000
    Ca0.10000

    Table 3.

    Element analysis of RHBC, RHAC600, RHAC700, RHAC800 and RHAC900 by EDS/wt%

    The temperature (~25 ℃), initial concentration of MB solution (500 mg/L) and contact time (180 min) were set up to estimate the MB adsorption performance of RHACs and YP-80. As the amount of adsorbent decreasing, the adsorption limit of RHACs and YP-80 appeared one by one, as shown inFig. 3(a, d). The adsorption efficiency and capacity are associated with the SSA BET, and the higher the specific surface area, the larger the adsorption capacities[25]. As shown in Table 1, the maximum adsorption capacity is 983 mg/g for the RHAC900 which possesses the highest SSABET of 3600 m2/g. Nevertheless, the adsorption capacity of the RHAC800 (919 mg/g) is slightly lower than that of the RHAC700 (935 mg/g). In the case of ultra-high SSABET (>3000 m2/g), the minute difference of SSABET has no significant effect on adsorption capacity which is mainly affected by pore size and volume of materials[26]. As can be seen from Fig. 2(d), the mesopore size range of the RHAC700 is wider than that of RHAC800(as listed in Table 1), indicating higher adsorption capacity and faster mass transfer rate (the insets of Fig. 3(c,d)).

    Effects of contact time and mass of adsorbent on the adsorption capacity

    Figure 3.Effects of contact time and mass of adsorbent on the adsorption capacity

    Meanwhile, due to the high SSABET of 3600 m2/g, the greatly wide mesoporous size distribution from 2.5 nm to 14 nm and ultra-large total pore volume of 3.164 cm3/g, the RHAC900 has the highest adsorption capacity of 983 mg/g. Although micropore volume of RHAC900 is smaller than that of RHAC800 and close to others, the mesopore volume of RHAC900 is far larger than those of other RHACs (Table 1), resulting in fastest adsorption rate (Fig. 3(d))[27]. On the whole, all of RHACs exhibit more outstanding adsorption performance than the commercial AC (YP-80). As seen from Table S1, the SSABET and pore volume have a crucial influence on the adsorption capacity for MB and the performance of RHAC in this study is much better than other carbon reported.

    Kinetic studies were conducted to further understand the adsorption mechanism in the adsorption processes for MB, and the pseudo-first-order model and the pseudo- second-order model were used to fit the adsorption data[19]. For the fitting processes, the correlation coefficients (R2) are determined for two models and each adsorbent, and the higher valueR2 is deemed as the better fitting[28].

    The linear fit of the pseudo-first-order model and the values of the correlation coefficients are shown in Fig. S3(a-f). The results indicate a relatively good linear fit for RHAC600 and RHAC800, with R2=0.9352 and R2=0.938, respectively. Table S2 shows the values of the kinetic adsorption constants obtained from the application of the pseudo-first-order model for each RHAC. Only when the difference between qe (experimental) and q1 (calculated) is the smallest possible, the kinetic models are significant[28]. However, all differences between those parameters exceed 45%. Hence, the pseudo-first- order model can’t describe the adsorption process of these carbon.

    Linear fits of the pseudo-first-order models for five carbons: (a) YP-80, (b) RHAC600,(c) RHAC700, (d) RHAC800, (e) RHAC900 and (f) correlation coefficients

    Figure S3.Linear fits of the pseudo-first-order models for five carbons: (a) YP-80, (b) RHAC600,(c) RHAC700, (d) RHAC800, (e) RHAC900 and (f) correlation coefficients

    RHRHBCRHAC600RHAC700RHAC800RHAC900
    Before/mg2502.01002.4148.176.388.753.9
    After/mg375.0330.00000
    Ash content/%14.9932.92

    Table 4.

    Mass and ash content of RH, RHBC, RHAC600, RHAC700, RHAC800 and RHAC900 before and after calcination

    The linear fit of the pseudo-second-order model and the values of the correlation coefficients are shown in Fig. 4(a-f). The results indicate a perfect linear fit for RHACs and YP-80. All of the correlation coefficients (R2) are extremely close to 1 suggesting that the pseudo- second-order model can precisely describe the adsorption process of MB. Meanwhile, in Table 2, all of the difference between qe (experimental) and q2 (calculated) of each sample are also small enough to confirm that the adsorption process is consistent with the pseudo-second- order model.

    Linear fits of the pseudo-second-order models for the adsorption of MB on (a) YP-80, (b) RHAC600, (c) RHAC700, (d) RHAC800, (e) RHAC900, and (f) corresponding correlation coefficients

    Figure 4.Linear fits of the pseudo-second-order models for the adsorption of MB on (a) YP-80, (b) RHAC600, (c) RHAC700, (d) RHAC800, (e) RHAC900, and (f) corresponding correlation coefficients

    Sampleqe (exp)/ (mg•g-1) q2(cal)/ (mg•g-1) Percentual difference (qe-q2)/% k2/(g•mg-1•min-1)
    YP-80525526.3-0.250.0090
    RHAC600851833.32.080.0006
    RHAC700935833.310.880.0018
    RHAC800919909.11.080.0007
    RHAC9009831000-1.730.0025

    Table 2.

    Kinetic parameters obtained of RHACs and YP-80 by the pseudo-second-order model for the adsorption of MB

    The results of kinetic fitting indicate that the possible chemisorption of MB on the surface of RHAC may be realized by forming chemical complexes with functional groups[29]. All products only contain C and O leading to pretty low ash content (Table S3 & S4, Fig. S4) and oxygen-containing functional groups on the surface. The broad band at 3456 cm -1 is due to the O-H stretching mode of hydroxyl groups (from carboxyl groups, phenols or alcohols) and adsorbed water. The band at 1597 cm-1 is attributed to C-O stretching vibration from ketones, aldehydes, lactones or carboxyl groups. The peak at 1357 cm-1 is assigned to C-O stretching and O-H bending modes of alcoholic, phenolic and carboxylic groups. After adsorption for MB, the intensity of band decreased and the frequency of several groups changed, which indicates that the chemisorption occurred between MB and RHAC (Fig. S5). Therefore, the results of kinetic fitting are consistent with the FT-IR characterization. This adsorption mechanism can promote the clear adsorption of the adsorbent surface without allowing its reuse[28].

    Table Infomation Is Not EnableTable Infomation Is Not Enable

    Photos of RH, RHBC, RHAC600, RHAC700, RHAC800 and RHAC900 before and after calcination

    Figure S4.Photos of RH, RHBC, RHAC600, RHAC700, RHAC800 and RHAC900 before and after calcination

    FT-IR spectra of RHAC before and after MB adsorption

    Figure S5.FT-IR spectra of RHAC before and after MB adsorption

    3 Conclusion

    As considering that RHs possess intrinsic advantages of structure and compositions, AC with ultra-large specific surface area from RHs are successfully synthesized through pre-activation and activation by supersaturated KOH solution. All of these activated carbon materials have hierarchical pore structure, larger specific surface area and larger pore volume compared with the commercial carbon (YP-80) and carbon materials based on other agricultural bio-waste. The RHAC with largest SSA BET of 3600 m2/g is prepared at 900 ℃ and performs the adsorption capacity of 983 mg/g, which is almost twice as high as that of YP-80. Due to hierarchical pore structure in favor of adsorbing and transporting MB, the adsorption capacity of RHACs is superior to that of YP-80. The fitting results of the adsorption of MB on the RHs conforms the pseudo-second-order model indicating a chemisorption process. This study provides a feasible method for the reuse of RHs waste and large-scale preparation of AC with large specific surface area for water treatment.

    Supporting materials

    Ultra-large Specific Surface Area Activated Carbon Synthesized from Rice Husk with High Adsorption Capacity for Methylene Blue

    ZHOU Fan1,2, BI Hui1, HUANG Fuqiang1,2,3

    (1. State Key Laboratory of High Performance Ceramics and Superfine Microstructure, Shanghai Institute of Ceramics, Chinese Academy of Sciences, Shanghai 200050, China; 2. School of Physical Science and Technology, ShanghaiTech University, Shanghai 200031, China; 3. State Key Laboratory of Rare Earth Materials Chemistry and Applications, College of Chemistry and Molecular Engineering, Peking University, Beijing 100871, China)

    References:

    [1]MUDYAWABIKWA B, MUNGONDORI H H, TICHAGWA L, et al. Methylene blue removal using a low-cost activated carbon adsorbent from tobacco stems: kinetic and equilibrium studies. Water Science & Technology, 2017, 75(10): 2390-2402.

    [2]PATAWAT C, SILAKATE K, CHUAN-UDOM S, et al. Preparation of activated carbon from Dipterocarpus alatus fruit and its application for methylene blue adsorption. RSC Advances, 2020, 10(36): 21082-21091.

    [3]LI D, YAN J, LIU Z, et al. Adsorption kinetic studies for removal of methylene blue using activated carbon prepared from sugar beet pulp. International Journal of Environmental Science and Technology, 2016, 13(7): 1815-1822.

    [4]GARCIA J R, SEDRAN U, ZAINI M A A, et al. Preparation, characterization, and dye removal study of activated carbon prepared from palm kernel shell. Environmental Science and Pollution Research, 2018, 25(6): 5076-5085.

    [5]BASTA A H, LOTFY V F, HASANIN M S,et al. Efficient treatment of rice byproducts for preparing high-performance activated carbons. Journal of Cleaner Production, 2019, 207: 284-295.

    [6]LIU Q X, ZHOU Y R, WANG M,et al. Adsorption of methylene blue from aqueous solution onto viscose-based activated carbon fiber felts: kinetics and equilibrium studies. Adsorption Science & Technology, 2019, 37(3/4): 312-332.

    [7]DUAN X, SRINIVASAKANNAN C, WANG X, et al. Synthesis of activated carbon fibers from cotton by microwave induced H3PO4 activation. Journal of the Taiwan Institute of Chemical Engineers, 2017, 70: 374-381.

    [8]SPAGNOLI A A, GIANNAKOUDAKIS D A, BASHKOVA S. Adsorption of methylene blue on cashew nut shell based carbons activated with zinc chloride: the role of surface and structural parameters.Journal of Molecular Liquids, 2017, 229: 465-471.

    [9]ÜNER O. Hydrogen storage capacity and methylene blue adsorption performance of activated carbon produced from Arundo donax.Materials Chemistry and Physics, 2019, 237: 121858.

    [10]ZHU G, XING X, WANG J, et al. Effect of acid and hydrothermal treatments on the dye adsorption properties of biomass-derived activated carbon. Journal of Materials Science, 2017, 52(13): 7664-7676.

    [11]MI B, WANG J, XIANG H, et al. Nitrogen self-doped activated carbons derived from bamboo shoots as adsorbent for methylene blue adsorption. Molecules, 2019, 24(16): 3012.

    [12]ALCARAZ L, LÓPEZ FERNÁNDEZ A, GARCÍA-DÍAZ I, et al. Preparation and characterization of activated carbons from winemaking wastes and their adsorption of methylene blue.Adsorption Science & Technology, 2018, 36(5/6): 1331-1351.

    References

    [1] E MENYA, W OLUPOT P, H STORZ et al. Production and performance of activated carbon from rice husks for removal of natural organic matter from water: a review. Chemical Engineering Research and Design, 129, 271-296(2018).

    [2] T YAGUB M, K SEN T, S AFROZE et al. Dye and its removal from aqueous solution by adsorption: a review. Advances in Colloid and Interface Science, 209, 172-84(2014).

    [3] Y ZHOU, J LU, Y ZHOU et al. Recent advances for dyes removal using novel adsorbents: a review. Environmental Pollution, 252, 352-365(2019).

    [4] D SILVA L A, S BORGES S M, N PAULINO P et al. Methylene blue oxidation over iron oxide supported on activated carbon derived from peanut hulls. Catalysis Today, 289, 237-248(2017).

    [5] Z GUO, Z XIAO, G REN et al. Natural tea-leaf-derived, ternary- doped 3D porous carbon as a high-performance electrocatalyst for the oxygen reduction reaction. Nano Research, 9, 1244-1255(2016).

    [6] X DUAN, C SRINIVASAKANNAN, X WANG et al. Synthesis of activated carbon fibers from cotton by microwave induced H3PO4 activation. Journal of the Taiwan Institute of Chemical Engineers, 70, 374-381(2017).

    [7] W TAN I A, L AHMAD A, H HAMEED B. Adsorption of basic dye on high-surface-area activated carbon prepared from coconut husk: equilibrium, kinetic and thermodynamic studies. Journal of Hazardous Materials, 154, 337-346(2008).

    [8] J CHOMA, L OSUCHOWSKI, M MARSZEWSKI et al. Developing microporosity in Kevlar®-derived carbon fibers by CO2 activation for CO2 adsorption. Journal of CO2 Utilization, 16, 17-22(2016).

    [9] X LIU Q, R ZHOU Y, M WANG et al. Adsorption of methylene blue from aqueous solution onto viscose-based activated carbon fiber felts: Kinetics and equilibrium studies. Adsorption Science & Technology, 37, 312-332(2019).

    [10] C PATAWAT, K SILAKATE, S CHUAN-UDOM et al. Preparation of activated carbon from Dipterocarpus alatus fruit and its application for methylene blue adsorption. RSC Advances, 10, 21082-21091(2020).

    [11] G ZHU, X XING, J WANG, AL ET. Effect of acid and hydrothermal treatments on the dye adsorption properties of biomass- derived activated carbon. Journal of Materials Science, 52, 7664-7676(2017).

    [12] D LI, J YAN, Z LIU et al. Adsorption kinetic studies for removal of methylene blue using activated carbon prepared from sugar beet pulp. International Journal of Environmental Science and Technology, 13, 1815-1822(2016).

    [13] B MUDYAWABIKWA, H MUNGONDORI H, L TICHAGWA et al. Methylene blue removal using a low-cost activated carbon adsorbent from tobacco stems: kinetic and equilibrium studies. Water Science & Technology, 75, 2390-2402(2017).

    [14] B MI, J WANG, H XIANG et al. Nitrogen self-doped activated carbons derived from bamboo shoots as adsorbent for methylene blue adsorption. Molecules, 24, 3012(2019).

    [15] Z WANG, T SMITH A, W WANG et al. Versatile nanostructures from rice husk biomass for energy applications. Angewandte Chemie International Edition, 57, 13722-13734(2018).

    [16] Z CHEN, Y XU, S SHIVKUMAR. Microstructure and tensile properties of various varieties of rice husk. Journal of the Science of Food and Agriculture, 98, 1061-1070(2018).

    [17] Z CHEN, X WANG, B XUE et al. Rice husk-based hierarchical porous carbon for high performance supercapacitors: The structure- performance relationship. Carbon, 161, 432-444(2020).

    [18] A ISLAM M, J AHMED M, A KHANDAY W et al. Mesoporous activated carbon prepared from NaOH activation of rattan (Lacosperma secundiflorum) hydrochar for methylene blue removal. Ecotoxicology Environmental Safety, 138, 279-285(2017).

    [19] A ISLAM M, S SABAR, A BENHOURIA et al. Nanoporous activated carbon prepared from karanj (Pongamia pinnata) fruit hulls for methylene blue adsorption. Journal of the Taiwan Institute of Chemical Engineers, 74, 96-104(2017).

    [20] H BASTA A, F LOTFY V, S HASANIN M et al. Efficient treatment of rice byproducts for preparing high-performance activated carbons. Journal of Cleaner Production, 207, 284-295(2019).

    [21] X HE, P LING, M YU et al. Rice husk-derived porous carbons with high capacitance by ZnCl2 activation for supercapacitors. Electrochimica Acta, 105, 635-641(2013).

    [22] D LOZANO-CASTELLÓ, M CALO J, D CAZORLA-AMORÓS et al. Carbon activation with KOH as explored by temperature programmed techniques, and the effects of hydrogen. Carbon, 45, 2529-2536(2007).

    [23] Y GAO, L LI, Y JIN et al. Porous carbon made from rice husk as electrode material for electrochemical double layer capacitor. Applied Energy, 153, 41-47(2015).

    [24] C LI, D HE, H HUANG Z et al. Hierarchical micro-/mesoporous carbon derived from rice husk by hydrothermal pre-treatment for high performance supercapacitor. Journal of The Electrochemical Society, 165, A3334-A3341(2018).

    [25] A SPAGNOLI A, A GIANNAKOUDAKIS D, S BASHKOVA. Adsorption of methylene blue on cashew nut shell based carbons activated with zinc chloride: the role of surface and structural parameters. Journal of Molecular Liquids, 229, 465-471(2017).

    [26] V VADIVELAN, V KUMAR K. Equilibrium, kinetics, mechanism, and process design for the sorption of methylene blue onto rice husk. Journal of Colloid and Interface Science, 286, 90-100(2005).

    [27] O ÜNER. Hydrogen storage capacity and methylene blue adsorption performance of activated carbon produced from Arundo donax. Materials Chemistry and Physics, 237, 121852(2019).

    [28] G ORLANDI, J CAVASOTTO, R MACHADO F et al. An adsorbent with a high adsorption capacity obtained from the cellulose sludge of industrial residues. Chemosphere, 169, 171-180(2017).

    [29] K MAHMOUDI, K HOSNI, N HAMDI et al. Kinetics and equilibrium studies on removal of methylene blue and methyl orange by adsorption onto activated carbon prepared from date pits-A comparative study. Korean Journal of Chemical Engineering, 32, 274-283(2014).

    Fan ZHOU, Hui BI, Fuqiang HUANG. Ultra-large Specific Surface Area Activated Carbon Synthesized from Rice Husk with High Adsorption Capacity for Methylene Blue[J]. Journal of Inorganic Materials, 2020, 36(8): 893
    Download Citation