• Laser & Optoelectronics Progress
  • Vol. 58, Issue 14, 1430002 (2021)
Lanze Zhang1, Hong Jiang1、*, Jintong Liu1, Jiageng Wang2, and Ji Man3
Author Affiliations
  • 1School of Investigation, People's Public Security University of China, Beijing 100038, China
  • 2Fengtai Branch of Beijing Municipal Public Security Bureau, Beijing 100071, China
  • 3Beijing Huayi Hongsheng Technology Co., Ltd., Beijing 100123, China
  • show less
    DOI: 10.3788/LOP202158.1430002 Cite this Article Set citation alerts
    Lanze Zhang, Hong Jiang, Jintong Liu, Jiageng Wang, Ji Man. Classification of Rubber Soles by X-ray Fluorescence Spectrometry Based on Multiple Linear Regression[J]. Laser & Optoelectronics Progress, 2021, 58(14): 1430002 Copy Citation Text show less
    Score of shoe types
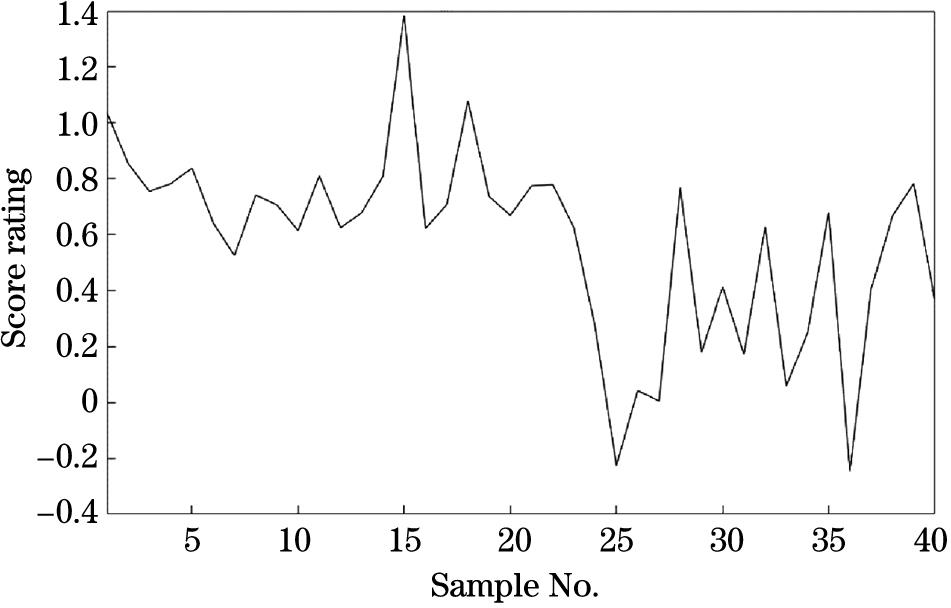
    Fig. 1. Score of shoe types
    Flow chart of multivariate linear regression classification method
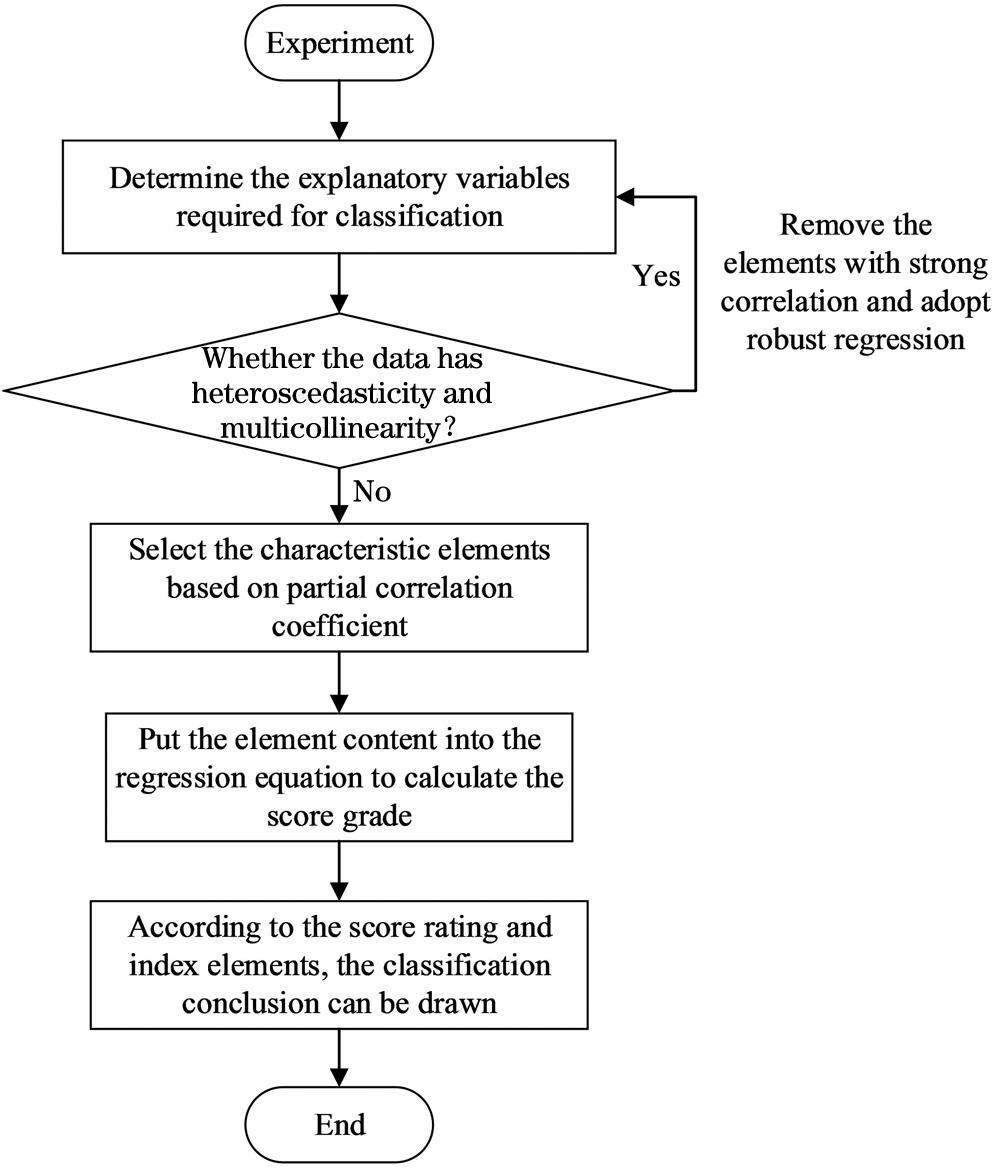
    Fig. 2. Flow chart of multivariate linear regression classification method
    No.BrandShoe typeMale or female
    1AOKANGLeather shoeFemale
    2YONGLIANGLeather shoeMale
    3NIKECasual shoeMale
    4UnknownRunning shoeMale
    5CrocodileLeather shoeMale
    6LouisLeather shoeMale
    7YONGLIANGLeather shoeMale (special sole material)
    8PLOVERLeather shoeMale
    9GALeather shoeMale (military sole material)
    10CamelLeather shoeMale
    11SHEN TACasual shoeFemale
    12JRV NALILeather shoeMale
    13DAPHNELeather shoeFemale
    14People's Public Security University of ChinaLeather shoeMale
    15DAPHNELeather shoeFemale
    No.BrandShoe typeMale or female
    16Z.SuoCasual shoeMale
    17WarriorCasual shoeMale
    18LiNingBasketball shoeMale
    19ANTABasketball shoeMale
    20OLUNPOLeather shoeMale
    21361°Basketball shoeMale
    22NIKEBasketball shoeMale
    23UnknownLeather shoeMale
    24AOKANGLeather shoeFemale
    25YANG DACasual shoeMale
    26NIKERunning shoeMale
    27361°Casual shoeMale
    28NIKESlipperMale
    29YINGYUEGULeather shoeMale
    30MISTRALCasual shoeMale
    31PUMACasual shoeMale
    32SENDALeather shoeMale
    33NIKESoccer shoeMale
    34NiuAiKeLeather shoeMale
    35AOKANGLeather shoeMale
    36AOKANGLeather shoeMale
    37AdidasCasual shoeMale
    38People's Public Security University of ChinaLeather shoeMale
    39People's Public SecurityUniversity of ChinaLeather shoeMale
    40People's Public Security University of ChinaLeather shoeMale
    Table 1. List of relevant information of rubber sole samples
    VariableExplanation of variables
    KindLeather shoes are marked as 1 and other types of shoes are marked as 0
    Gender1 for men's shoes and 0 for women's shoes
    ElementSeven kinds of elements in rubber sole
    Table 2. Variable description
    KindFrequencyProportion /%Cumulative proportion /%
    Leather shoe2357.557.5
    Casual shoe922.580.0
    Basketball shoe410.090.0
    Running shoe25.095.0
    Football shoe12.597.5
    Slipper12.5100.0
    Table 3. Descriptive statistical results of types of shoes
    ElementMean /10-6Std. Dev. /10-6Min /10-6Max /10-6
    Ca22572.829050.95135128227
    Ti6010.62511462.14049237
    Zn9464.0256429.3433226219
    Pb386.5251372.05307975
    Fe605.1751027.58204959
    Cu69.2555.838020201
    Sb69.57553.307470285
    Table 4. Statistical analysis of sample element content
    VariableRobust
    ηCoefEStdtP[95%Conf. Interval]
    Gender-0.23049340.2608486-0.880.384-0.76249760.3015108
    Ca-4.44×10-61.68×10-6-2.650.013-7.86×10⁻⁶-1.02×10⁻⁶
    Zn6.05×10-60.00001290.470.641-0.00002020.0000323
    Fe0.00015240.000081.910.066-0.00001070.0003154
    Sb0.00102580.00060191.70.098-0.00020180.0022534
    Cu-0.00225860.0012021-1.880.07-0.00471040.0001931
    Ti-0.00001994.46×10-6-4.460-0.000029-0.0000108
    Pb-0.00003170.0000385-0.820.417-0.00011030.0000469
    Cons0.94430760.30064263.140.0040.33114311.557472
    Table 5. Re-regression results of sample element content
    VariableElement content /10-6
    CaCuTiFeSb
    Others28689.1880.3512992.82170.5358.06
    Leather shoe18052.0061.04849.87926.4378.09
    Table 6. Average element content of different shoes
    VariableηCoefEStdtPα
    Ca-4.45×10-62.18×10-6-2.040.049-0.2581123
    Cu-0.00224860.0011303-1.990.055-0.2507974
    Ti-0.00001985.51×10-6-3.590.001-0.4522083
    Fe0.00017990.00006352.830.0080.3693422
    Cons0.84094470.11780957.140
    Table 7. Standardized regression results of each element in the sample
    VariableFVIF1/FVIF
    Fe1.110.897329
    Ca1.050.95281
    Ti1.040.958093
    Cu1.040.958947
    Mean FVIF1.06
    Table 8. Test results of multicollinearity
    Sample No.Element content /10-6
    CaFeCuTi
    2812610300
    3222850722074
    352152811701230
    38162720242394
    392934081365
    Table 9. Element content of misclassified samples
    VariableElement content /10-6Score rating
    CaCuTiFe
    Yongliang leather shoe2172006470.947675
    Yongliang leather shoe (combustion group)2312006010.938776
    Crocodile leather shoe17573008880.922496
    Crocodile leather shoe (bloodstain group)16326008280.917251
    Z. Suo casual shoe8007302104500.067929
    Z. Suo casual shoe (soil group)7907402031500.086828
    Huili casual shoe (paint group)85402367900.3683
    Yangda casual shoe (control group)10780647935400.070315
    Yangda casual shoe (ink group)10963460970600.025979
    Table 10. Sample regression results of simulating the real situation of cases
    Lanze Zhang, Hong Jiang, Jintong Liu, Jiageng Wang, Ji Man. Classification of Rubber Soles by X-ray Fluorescence Spectrometry Based on Multiple Linear Regression[J]. Laser & Optoelectronics Progress, 2021, 58(14): 1430002
    Download Citation