Photoionized plasma is an important existing form of plasmas in the universe. Celestial objects, such as AGN and X-ray binary, can emit strong radiation field and the high energy photos can ionize the surrounding gases. Thus, the low temperature gases can emit lines of highly ionized ions. The He-α lines are important method to diagnose the electron temperature and density of photoionized plasmas. As the development of the high energy density physics, the photoionized plasmas have been produced in the laboratories. In 2009, Fujioka et al. used the GEKKO-XII laser facility to produce photoionized silicon plasma. The experimental spectrum, the black solid line in Figure 1, is similar as that of Vela X-1, which is a typical X-ray binary. To simulate and illustrate the experimental spectrum is always a difficult problem, where the peak around 1855 eV (intercombination line) is always absent in the simulations.
Researchers from Beijing Normal University and National Astronomical Observatories, Chinese Academy of Sciences successfully simulated the experimental spectrum of photoionized silicon plasma, which was produced by Fujioka et al. in 2009. The related research results are published in High Power Laser Science and Engineering, Vol. 9, Issue 1, 2021 (Bo Han, Feilu Wang, David Salzmann, Jiayong Zhong, Gang Zhao. Emission mechanism for the silicon He-α lines in a photoionization experiment[J]. High Power Laser Science and Engineering, 2021, 9(1): 010000e9).
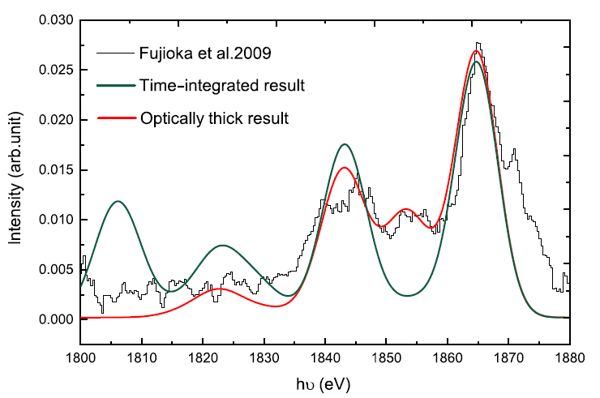
Figure 1 The black solid line is the experimental spectrum of Fujioka et al.2009. The green solid line is the time-integrated result. The red solid line is the optically thick result.
RCF is a code to simulate the spectrum of plasma, which is developed by ourself, and it has successfully simulated the charge state distribution of Foord et al. 2004 Fe photoionization experiment. The present work uses three versions of RCF, which are steady-state optically thin, time-dependent optically thin and steady-state optically thick models. The steady-state optically thin model shows that photoexcitation can produce strong resonance line (1864.8 eV) and Li-like lines (around 1844 eV), but the intercombination line is weak. The green solid line in Figure 1 is the time-integrated result of the time-dependent optically thin model, and the intercombination line is not reproduced, neither. The high energy photons also produce strong resonance line and Li-like lines. Finally, we use the steady-state optically thick model to produce the red solid line in Figure 1, which is the closest result to the experimental spectrum as far as we know. The reason is the resonance line and Li-like lines are also easily reduced by the photo-reabsorption, and the relative strength rises.
In their previous works, the RCF is well benchmarked by the photoionization experiments. They are trying to apply it to some astrophysical problems in our further works. It is an interesting work to develop a code applying to both experimental and astrophysical photoionized plasmas.