
Chengjuan Yang, Xue Yang, Meng Wang, Fujun Wang, Beichao Shi, Xinyao Zhu. Application of Bionic Superhydrophobic Surface in Jaw End Face of Microgripper[J]. Chinese Journal of Lasers, 2022, 49(10): 1002602
- Chinese Journal of Lasers
- Vol. 49, Issue 10, 1002602 (2022)
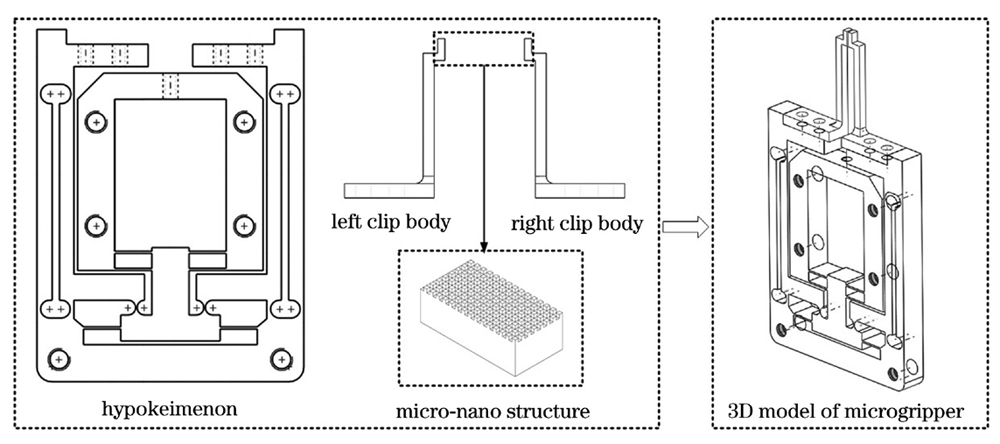
Fig. 1. Model of detachable microgripper with bionic superhydrophobic structure
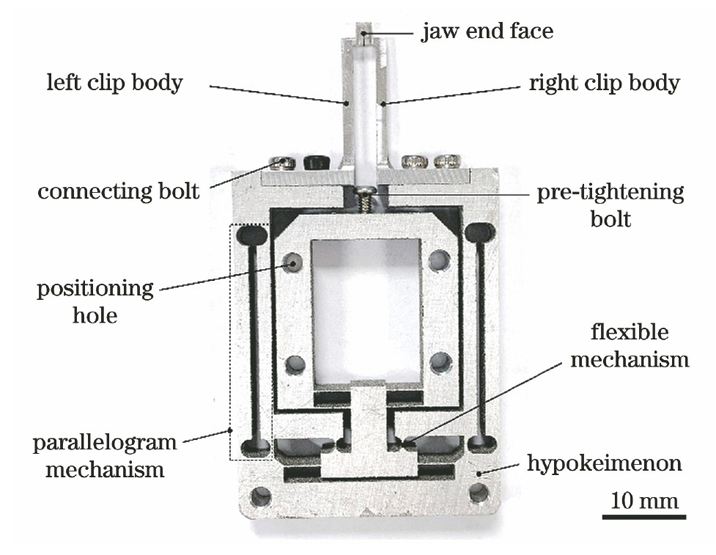
Fig. 2. Physical picture of microgripper
Fig. 3. Schematic of nanosecond laser processing system and laser scanning path
Fig. 4. Physical comparison of functionalized jaw end face and original jaw end face
Fig. 5. Measured XPS and C 1s high-resolution spectra. XPS of (a) Al-Ⅰ and (b) Al-Ⅱ samples; C 1s high-resolution spectra fitted by the spectrum peaks of (c) Al-Ⅰ and (d) Al-Ⅱ samples
Fig. 6. Comparison of corrosion of Al-Ⅰ and Al-Ⅱ samples in acids, salts, and alkali solutions. (a)(e) Uncorroded samples; (b)(f) samples corroded by HCl solution at pH=2; (c)(g) samples corroded by NaCl solution at pH=7; (d)(h) samples corroded by NaOH solution at pH=12
Fig. 7. Polarization curves of Al-Ⅰ and Al-Ⅱ samples in pH=2, pH=7, and pH=12 solutions
Fig. 8. Comparison of electrochemical impedance spectra and polarization curves of Al-Ⅰ and Al-Ⅱ samples. Nyquist plots of samples in solutions with (a) pH=2, (b) pH=7, and (c) pH=12; (d) Bode diagram and fitting curves of impedance modulus and frequency; (e) Bode diagram and fitting curves of phase angle and frequency
Fig. 9. Equivalent circuit of EIS curves. (a) Al-Ⅰ and Al-Ⅱ surfaces at pH=2 and Al-Ⅰsurface at pH=7; (b) Al-Ⅱ surface at pH=7; (c) Al-Ⅰ surface and Al-Ⅱ surface at pH=12
Fig. 10. Comparison of self-cleaning effects of Al-Ⅰ and Al-Ⅱ sample surfaces, both at a scale of 5 mm. (a)(i) Al-Ⅰ sample; (j)(r) Al-Ⅱ sample
Fig. 11. Anti-icing ability test of 7075 aluminum sample, all scales are 10 mm. (a) Schematic of anti-icing test device; comparison of surface freezing and anti-icing processes between (b)(j) original Al-Ⅰ sample and (k)(s) superhydrophobic Al-Ⅱ sample
Fig. 12. Laser confocal microscopy of escherichia coli on the sample surface. Distributions of (a) viable bacteria and (b) dead bacteria in Al-Ⅰ sample; distributions of (c) viable bacteria and (d) dead bacteria in Al-Ⅱ sample
Fig. 13. Colony count of remaining bacteria in plate coating at different dilution ratio. (a)(c) Bare group; (d)(f) original sample; (g)(i) superhydrophobic sample
|
Table 1. Corrosion results of Al-Ⅰ and Al-Ⅱ samples in different solutions obtained by polarization curves
|
Table 2. Comparison of bacterial inhibition after 105 times dilution

Set citation alerts for the article
Please enter your email address
© Copyright 2018-2021 | Chinese Laser Press. All Rights Reserved 沪ICP备15018463号-20