Jae-Young Jang, Myungjin Cho, Eun-Soo Kim, "3D image reconstruction with controllable spatial filtering based on correlation of multiple periodic functions in computational integral imaging," Chin. Opt. Lett. 13, 031101 (2015)
Copy Citation Text
We propose a novel method of slice image reconstruction with controllable spatial filtering by using the correlation of periodic delta-function arrays (PDFAs) with elemental images in computational integral imaging. The multiple PDFAs, whose spatial periods correspond to object’s depths with the elemental image array (EIA), can generate a set of spatially filtered EIAs for multiple object depths compared with the conventional method for the depth of a single object. We analyze a controllable spatial filtering effect by the proposed method. To show the feasibility of the proposed method, we carry out preliminary experiments for multiple objects and present the results.
Computational integral imaging (CII) is capable of extracting 3D information for occluded 3D objects[1–15]. In general, it is divided into two parts: pickup and computational reconstruction. In the pickup part, a set of 2D images with different perspectives of the 3D objects can be captured as elemental images through a lens array. From this captured elemental image array (EIA), the digital reconstruction part generates a set of slice images using a computational reconstruction technique based on simulated ray-optics. According to the reconstruction algorithm, the slice images were generated with different resolutions and viewing angles[4–7,16–20]. Among them, one method is to use the reconstruction of the volume pixels of the scene by computationally simulating optical reconstruction in accordance with ray optics[4]. Another method is based on rearrangement of pixels in the elemental image to reconstruct slice image with improved resolution[17]. Recently, a depth extraction method by using the periodic delta-function array (PDFA) in CII was proposed[18–20]. In this method, this PDFA can also generate the perspective slice image array with depth-dependent spatial filtering. This method can be applied to several applications including depth extraction, partially occluded 3D object reconstruction, optical refocusing display, and so on[19,20].
In this Letter, to improve the performance of the conventional PDFA-based CII, we propose a novel method of slice image reconstruction with controllable spatial filtering by using the correlation of PDFAs with elemental images in CII. The multiple PDFAs are generated with spatial periods corresponding to object’s depths in accordance with the EIA. They are used to generate a set of spatially filtered EIAs for multiple object depths compared with the conventional method for a single object depth. We analyze a spatial filtering effect by the proposed method and carry out preliminary experiments.
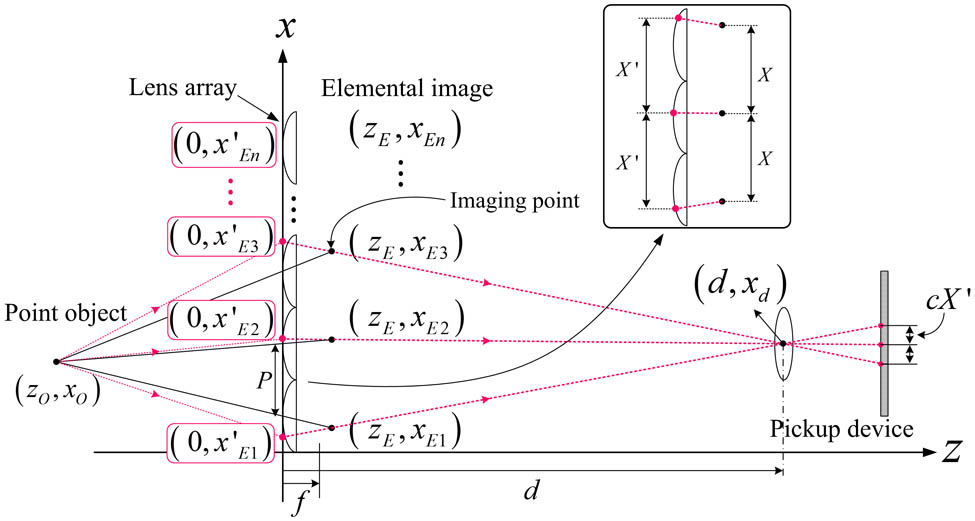
Before we explain the proposed method, we first present the spatial period in the pickup process. The process of capturing elemental images by the direct pickup method in the integral imaging system is based on ray optics. In the direct pickup method, the location of the pickup device may be considered for the imaging points of elemental images on the pickup sensor as shown in Fig. 1.
Sign up for Chinese Optics Letters TOC. Get the latest issue of Chinese Optics Letters delivered right to you!Sign up now
Figure 1.Geometrical relation between a point object and its corresponding imaging points in the direct pickup method with a lens array.
Let us consider that the rays emitted from the point object pass through the optical center of a pickup device’s lens. The geometrical relation between a point object, its corresponding points on the lens array, and location of pickup device can be given by
In Fig. 1 and Eq. (1), the origin of the coordinate system is the edge of the elemental lens located at the bottom of the lens array. and represent the positions of the point object along the - and -axes, respectively. represents the distance between the centers of the neighboring elemental lenses as well as the diameter of a single elemental lens. denotes the focal length of an elemental lens. In addition, represents a point on the th elemental lens, in which the valid is restricted by in the direct pickup condition and means the natural number. and represent the positions of the optical center of the pickup device’s lenses along the - and -axes, respectively.
From Eq. (1), the 1D form of the spatial period of the EIA depending on the object’s depth can be given by , where , and is the number of lateral elemental lenses. Then, the spatial period depending on the object’s depth can be calculated and given by
The latter part of Eq. (1) is approximated to zero when the distance of the pickup device from the lens array is increased. An approximated form of Eq. (1) may be given by
Equation (3) indicates the -coordinate corresponding to the imaging point of a point object by each elemental lens as shown in Fig. 1. The imaging distance, , of a point object measured from the lens array can be given by . The spatial period in Eq. (2) may also be approximated and denoted by Now, we explain the proposed method for slice image reconstruction with controllable spatial filtering. To control the spatial filtering for the recorded elemental image, we introduce the multiple PDFAs which can be generated with multiple spatial periods corresponding to object depth. An explanation for the proposed method is as follows.
The characteristics of an EIA in an integral imaging method can be represented, in terms of the intensity impulse response and the scaled object intensity, by using the periodic property of an EIA depending on object depth. In conventional 2D imaging, the image intensity can be represented as , where the asterisk denotes the convolution, represents the -coordinate on the EIA plane, represents the intensity impulse response, and represents the scaled object intensity while taking the image magnification into consideration. On the other hand, since the intensity impulse response and the object intensity are dependent on object depth , the image intensity for the 3D object can only be represented by having the -dependence. The -independent image intensity is written as follows
Assuming the geometrical optics condition of , the intensity impulse response can be represented by the function. The location of the function on the EIA plane can be denoted by imaging points. Therefore, using Eqs. (3) and (4), the intensity impulse response in Eq. (5) can be represented for an lens array system by , where is from Eq. (3), in which the number of lenses is 1, and is from Eq. (4). Therefore, the intensity impulse response can be given by As seen in Eq. (6) the intensity impulse response of the lens array system is expressed as a -function array whose spatial period varies depending on the object depth. The scaled object intensity with consideration of the geometrical imaging correspondence is given by Therefore, by substituting Eqs. (6) and (7) into Eq. (5), the intensity of the EIA can be represented as
Equation (8) implies that the intensity impulse response of an EIA is represented as a continuously distributed periodic function, because the object intensity is continuously distributed in all directions into the 3D object space. Additionally, the numbers of -function arrays are needed proportional to the numbers of points comprising the 3D object space.
The spatially periodic information corresponding to the targeting range of the object depth can be extracted from an EIA by using the sifting property of convolution between periodic functions where and are the range of the depth for extracting spatially periodic information from the captured EIA and the given distance value, respectively. The later part of Eq. (9) can be given by
Equation (10) is similar to Eq. (6) and the medium part of Eq. (8), but Eqs. (6) and (8) are the varying functions depending on - and -coordinates of an object (). However, Eq. (10) is just varied depending only on -coordinate of an object . This means, in the spatial filtering process for extraction of depth information from an EIA, just one -function array could represent one depth plane, which is ideally very thin in the 3D object space. From the results of Eqs. (9) and (10), we can see that the depth information could be extracted from an EIA at the continuous or partially continuous ranges. This can be represented by Therefore, Eq. (11) presents our controllable spatial filtering in the elemental images.
In addition, we analyze the depth resolution in the proposed method. The depth resolution of the sifting property of the convolution between periodic functions is defined as the minimum distance between two resolved points along the axis in the 3D object space and is given by where represents the number of pixels per lens, and denotes the spatial period corresponding to the object’s depth (and it is bounded by the relationship ).
To show the feasibility of the proposed method, preliminary experiments are carried out. We consider a direct pickup method to capture the EIA. In the experiment, two alphabetical representations of “Dog” and “Cat,” and two plane objects of “Dog” and “Cat,” are used as the test objects as shown on the right-hand side of Fig. 2 sampled from the EIA. The lens array was composed of elemental lenses, in which the focal length and the diameter of an elemental lens are given by 30 and 10 mm, respectively. Then, the capture EIA was composed of elemental images, in which each elemental image has a resolution of .
Figure 2.EIA captured from two alphabetical representations of “Dog” and “Cat,” and two plane objects of “Dog” and “Cat.”
Among the four test objects, two alphabetical representations of “Dog” and “Cat” are assumed to be located and from the lens array, respectively. Two plane objects of “Dog” and “Cat” are assumed to be located and from the lens array, respectively. The EIA captured from the test objects is shown on left-hand side of Fig. 2.
First, we calculated the depth resolution in our work. The depth resolution of the capturing system used in our work is shown in Fig. 3. The graphs are calculated in the basis of Eq. (12). Figure 3(a) shows the overall graph of the horizontal (distance) and vertical (spatial period) ranges from 30 to 1000 mm and from 600 to 1200 pixels, respectively. Figures 3(b)–3(d) show scaled graphs of Fig. 3(a), and indicates the distance of the test objects from the lens array.
Figure 3.Depth resolution of capturing system used in the work; (a) overall depth resolution; (b)–(d) scaled graphs of the overall depth resolution.
Next, we want to show the controllable spatial filtering for the recorded EIA. Figure 4 shows the spatial filtering result in the conventional method. A single depth was considered as shown in Fig. 4(a). Then, the spatially filtered EIA has only the single clear object as shown in Fig. 4(b).
Figure 4.Spatial filtering used in the conventional method; (a) filtering area; (b) spatially filtered elemental images.
On the other hand, our spatial filtering results in accordance with the required depth range from the EIA are shown in Fig. 5. We want to show the spatial filtering for two objects as shown in Figs. 5(a) and 5(c), respectively. Figure 5(b) is the result of the spatial filtering process, which is the calculation result of the definite integral over the range for our alphabetical representation of “Dog” and for the plane object of “Dog” in Eq. (11). Figure 5(d) is also the result of the spatial filtering process, which is the definite integral over the range for our alphabetical representation of “Cat” and for the plane object of “Cat” in Eq. (11). Then, by doing so, we can obtain the spatially filtered EIA as shown in Figs. 5(b) and 5(d), respectively. Their enlarged parts of Fig. 5 are also presented to confirm the selectivity of the depth range. From the results of Fig. 5, it is seen that our method can provide the control of the depth range for spatial filtering selectively.
Figure 5.Spatial filtering used in the proposed method; (a) filtering areas for alphabetical representations of “Dog” and plane object of “Dog;” (b) spatially filtered elemental images; (c) filtering areas for alphabetical representations of “Cat” and plane object of “Cat;” (d) spatially filtered elemental images.
By comparison between Figs. 4(b) and 5(b), the blur noise of the result images may be increased in the proposed multiple PDFAs method. The blurriness is related to both the number and the depth position of neighboring objects. That is, the blur noise can be increase when the neighbor object is near the target object depth and the number of neighboring objects is large. Therefore, Fig. 5(b) contains more blur noises because it was spatially filtered at the two different target object’s depth.
In conclusion, a novel method of slice image reconstruction with controllable spatial filtering by using the correlation of PDFAs with elemental images in CII is proposed. Since the multiple PDFAs have spatial periods corresponding to object depth with the EIA, we can generate a set of spatially filtered EIAs for multiple object depths. The proposed method is demonstrated for partially occluded object reconstruction experiments. Preliminary work reveals that our method can provide the control of depth range for spatial filtering selectively. We expect that the proposed method will be useful for various applications in CII.
Jae-Young Jang, Myungjin Cho, Eun-Soo Kim, "3D image reconstruction with controllable spatial filtering based on correlation of multiple periodic functions in computational integral imaging," Chin. Opt. Lett. 13, 031101 (2015)