• Photonics Research
  • Vol. 4, Issue 3, 0102 (2016)
W. L. Zhang*, Y. B. Song, X. P. Zeng, R. Ma, Z. J. Yang, and Y. J. Rao
Author Affiliations
  • Key Laboratory of Optical Fiber Sensing & Communications (Education Ministry of China), University of Electronic Science & Technology of China, Chengdu 611731, China
  • show less
    DOI: 10.1364/prj.4.000102 Cite this Article Set citation alerts
    W. L. Zhang, Y. B. Song, X. P. Zeng, R. Ma, Z. J. Yang, Y. J. Rao. Temperature-controlled mode selection of Er-doped random fiber laser with disordered Bragg gratings[J]. Photonics Research, 2016, 4(3): 0102 Copy Citation Text show less
    Schematic diagram of the experimental setup of the RFL. PM, power meter.
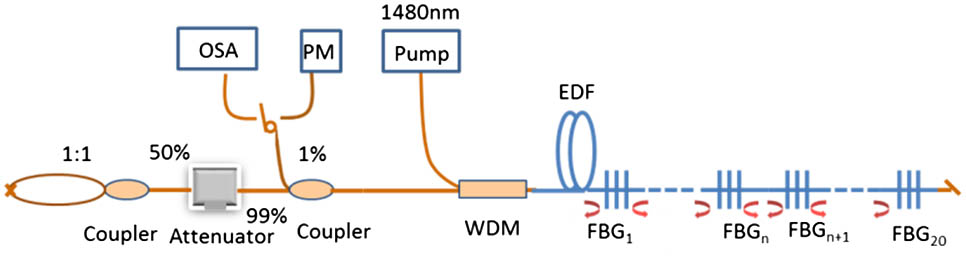
    Fig. 1. Schematic diagram of the experimental setup of the RFL. PM, power meter.
    Output power versus pump power for rt of 4%, 25%, and 50%, respectively.
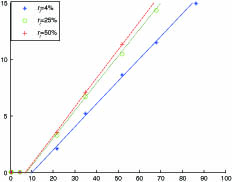
    Fig. 2. Output power versus pump power for rt of 4%, 25%, and 50%, respectively.
    Output spectra of the RFL measured at different times; (a)–(c) correspond to rt=4%, (d)–(f) correspond to rt=50%. The pump power is 67.7 mW.
    Fig. 3. Output spectra of the RFL measured at different times; (a)–(c) correspond to rt=4%, (d)–(f) correspond to rt=50%. The pump power is 67.7 mW.
    Output spectra of the stable and single mode emission when heating different locations of the FBG array. In the experiment, rt=4% and the pump power is 67.7 mW.
    Fig. 4. Output spectra of the stable and single mode emission when heating different locations of the FBG array. In the experiment, rt=4% and the pump power is 67.7 mW.
    Output spectra of the stable and single mode emission when heating different locations of the FBG array. In the experiment, rt=50% and the pump power is 67.7 mW.
    Fig. 5. Output spectra of the stable and single mode emission when heating different locations of the FBG array. In the experiment, rt=50% and the pump power is 67.7 mW.
    Peak wavelength and peak power of the selected modes versus time. In the experiment, rt=4% and the pump power is 67.7 mW.
    Fig. 6. Peak wavelength and peak power of the selected modes versus time. In the experiment, rt=4% and the pump power is 67.7 mW.
    Peak wavelength and peak power of the selected modes versus time. In the experiment, rt=4% and the pump power is 67.7 mW.
    Fig. 7. Peak wavelength and peak power of the selected modes versus time. In the experiment, rt=4% and the pump power is 67.7 mW.
    Peak wavelength of the stable and single mode emission versus control location for rt of 4% and 50%, respectively.
    Fig. 8. Peak wavelength of the stable and single mode emission versus control location for rt of 4% and 50%, respectively.
    W. L. Zhang, Y. B. Song, X. P. Zeng, R. Ma, Z. J. Yang, Y. J. Rao. Temperature-controlled mode selection of Er-doped random fiber laser with disordered Bragg gratings[J]. Photonics Research, 2016, 4(3): 0102
    Download Citation