
O. N. Rosmej, X. F. Shen, A. Pukhov, L. Antonelli, F. Barbato, M. Gyrdymov, M. M. Günther, S. Zähter, V. S. Popov, N. G. Borisenko, N. E. Andreev. Bright betatron radiation from direct-laser-accelerated electrons at moderate relativistic laser intensity[J]. Matter and Radiation at Extremes, 2021, 6(4): 048401
- Matter and Radiation at Extremes
- Vol. 6, Issue 4, 048401 (2021)
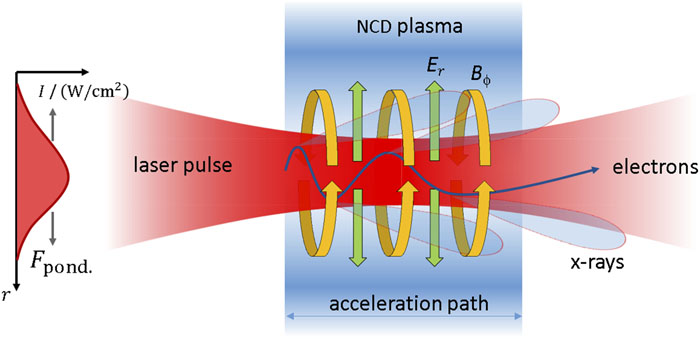
Fig. 1. Betatron radiation is generated when relativistic electrons undergo transverse betatron oscillations in self-generated quasistatic electric and magnetic fields.
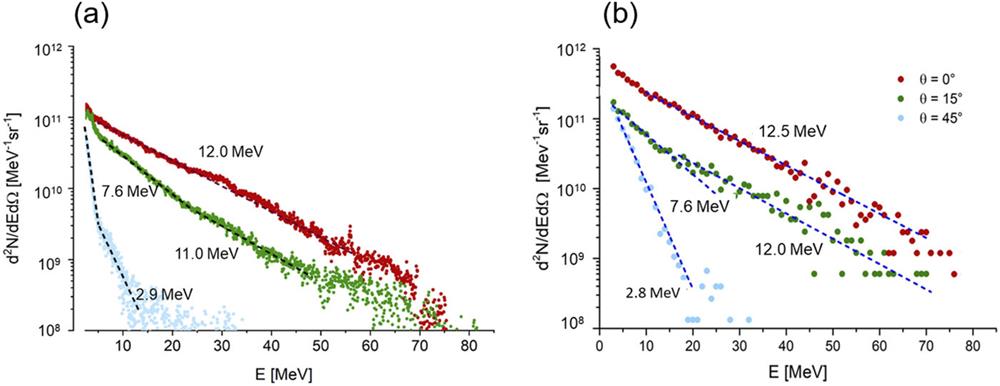
Fig. 2. (a) Energy distribution of super-ponderomotive electrons per steradian measured at 0° (red), 15° (green), and 45° (blue) to the laser propagation direction for a shot onto a pre-ionized foam layer at 2 × 10¹⁹ W/cm2 laser intensity. (b) PIC simulations for the same interaction parameters. Reprinted with permission from Rosmej et al. , Plasma Phys. Controlled Fusion 62 , 115024 (2020). Copyright 2020 Author(s), licensed under a Creative Commons Attribution 4.0 License.
Fig. 3. (a) Spectral distribution of the betatron radiation simulated for the PHELIX parameters. (b) 2D map of the photon fluence at the detector placed at a distance of 120 cm from the source.
Fig. 4. Comparison of line out for different distances from R 0 = 5 to R 0 = 50 cm. The total distance R 0 + R 1 = 120 cm. The highest phase enhancement was observed at R 0 = 15 cm.
Fig. 5. (a) Simulated XPCI radiograph. (b) Line out along the sphere axis [red dashed line in (a)]. The presence of phase enhancement is clearly visible around the sphere. We considered the betatron emission up to 40 keV and the sensitivity curve of the BAS-TR IP. For the x-ray source size, the worst case was assumed (an initial laser spot size of 15 µ m).
Fig. 6. Comparison between (a) absorption and (b) XPCI. The line out across the cylinder axis in (c) reveals the contribution of phase enhancement to the detection of the sphere, absorption by which is otherwise too weak to allow its detection under standard noisy experimental conditions.
|
Table 1. Comparison of betatron sources produced in LWFA, SMLWFA, and DLA processes.

Set citation alerts for the article
Please enter your email address
© Copyright 2018-2021 | Chinese Laser Press. All Rights Reserved 沪ICP备15018463号-20