
Yin Xiang, Ma Jun. Image Fusion Method Based on Entropy Rate Segmentation and Multi-Scale Decomposition[J]. Laser & Optoelectronics Progress, 2018, 55(1): 11011
- Laser & Optoelectronics Progress
- Vol. 55, Issue 1, 11011 (2018)
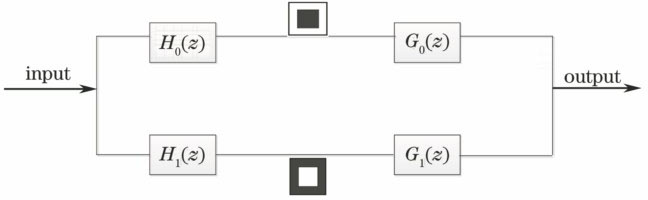
Fig. 1. First order decomposition and reconstruction of NSP
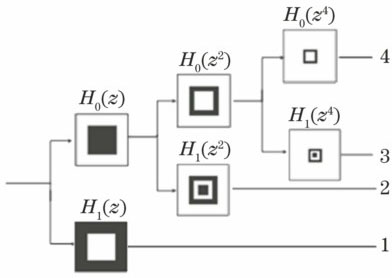
Fig. 2. Iteration structure of NSP double-channel filter banks
Fig. 3. Diagram of NSDFB cascading
Fig. 4. Influence of entropy rate on cluster compactness. (a) Entropy rate is 0.81; (b) entropy rate is 0.43; (c) entropy rate is 0.64; (d) entropy rate is 0.61
Fig. 5. Flow chart of proposed fusion method
Fig. 6. Fusion results on Pepsi image. (a) Left-focus image; (b) right-focus image; (c) NSCT fusion method; (d) WT fusion method; (e) PCNN fusion method; (f) entropy rate segmentation fusion method; (g) proposed method
Fig. 7. Fusion results on Disk. (a) Left-focus image; (b) right-focus image; (c) NSCT fusion method; (d) WT fusion method; (e) PCNN fusion method; (f) entropy rate segmentation fusion method; (g) proposed method
Fig. 8. Fusion results on Lab image. (a) Left-focus image; (b) right-focus image; (c) NSCT fusion method; (d) WT fusion method; (e) PCNN fusion method; (f) entropy rate segmentation fusion method; (g) proposed method
|
Table 1. Quality assessment results on fusion image of Pepsi
|
Table 2. Quality assessment results on fusion image of Disk
|
Table 3. Quality assessment results on fusion image of Lab

Set citation alerts for the article
Please enter your email address
© Copyright 2018-2021 | Chinese Laser Press. All Rights Reserved 沪ICP备15018463号-20