- Spectroscopy and Spectral Analysis
- Vol. 42, Issue 6, 1804 (2022)
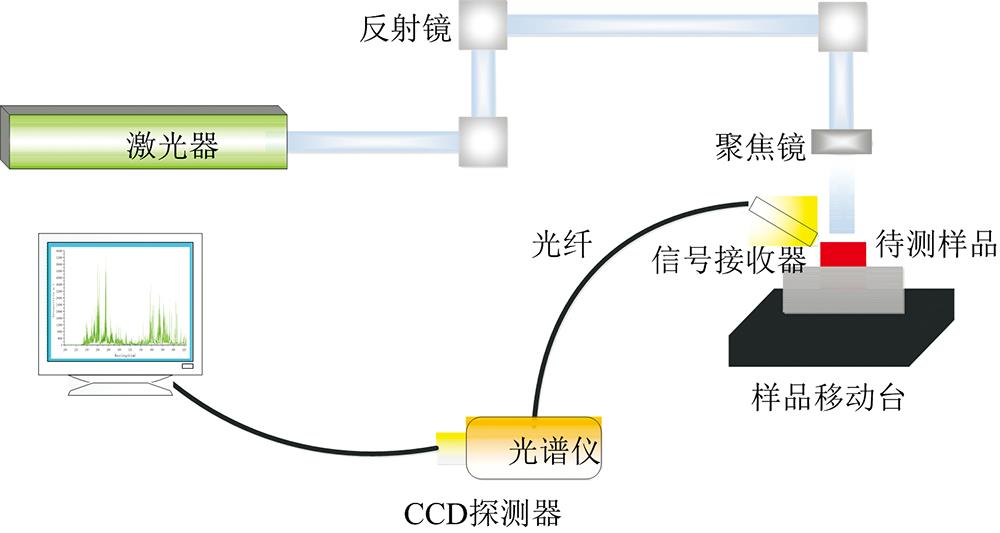
Fig. 1. Experimental setup
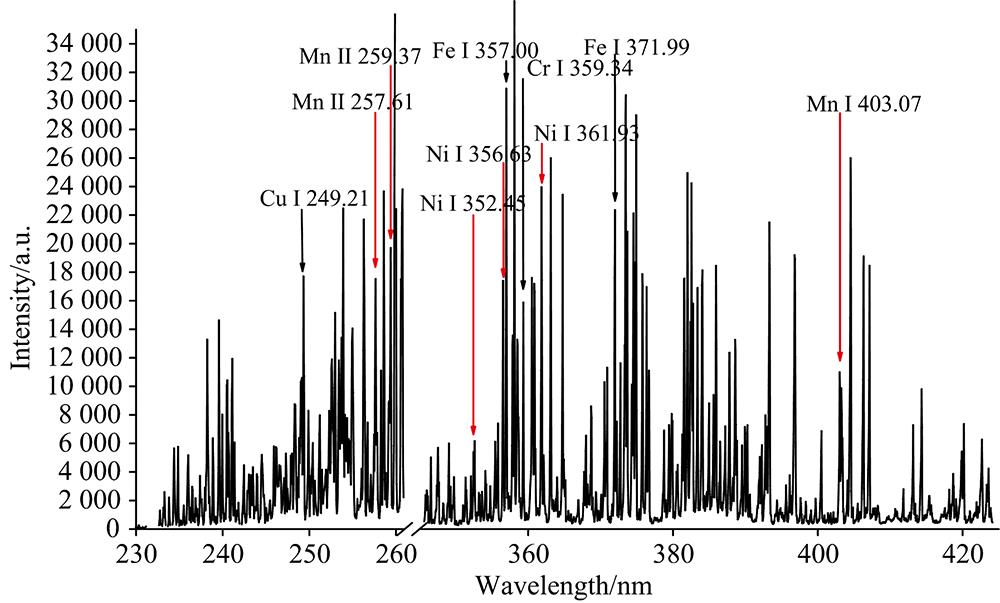
Fig. 2. Typical spectra of steel samples
Fig. 3. PLS model prediction results for Mn elements
Fig. 4. PLS model prediction results for Ni elements
Fig. 5. Screening and prediction results of Mn by GA-PLS
Fig. 6. Screening and prediction results of Ni by GA-PLS
|
Table 1. Content of Mn and Ni in 12 steel samples (Wt%)
| ||||||||||||||||||||||||||||||||||||||
Table 2. Comparison of results for PLS and GA-PLS models

Download Citation

Set citation alerts for the article
Please enter your email address
© Copyright 2018-2021 | Chinese Laser Press. All Rights Reserved 沪ICP备15018463号-20