
Xiaoshi Mi, Hui Zhao, Xuewu Fan, Lizhi Sheng. Photon-Counting Laser Altimetry Based on Microchannel Plate[J]. Acta Optica Sinica, 2018, 38(12): 1228001
- Acta Optica Sinica
- Vol. 38, Issue 12, 1228001 (2018)
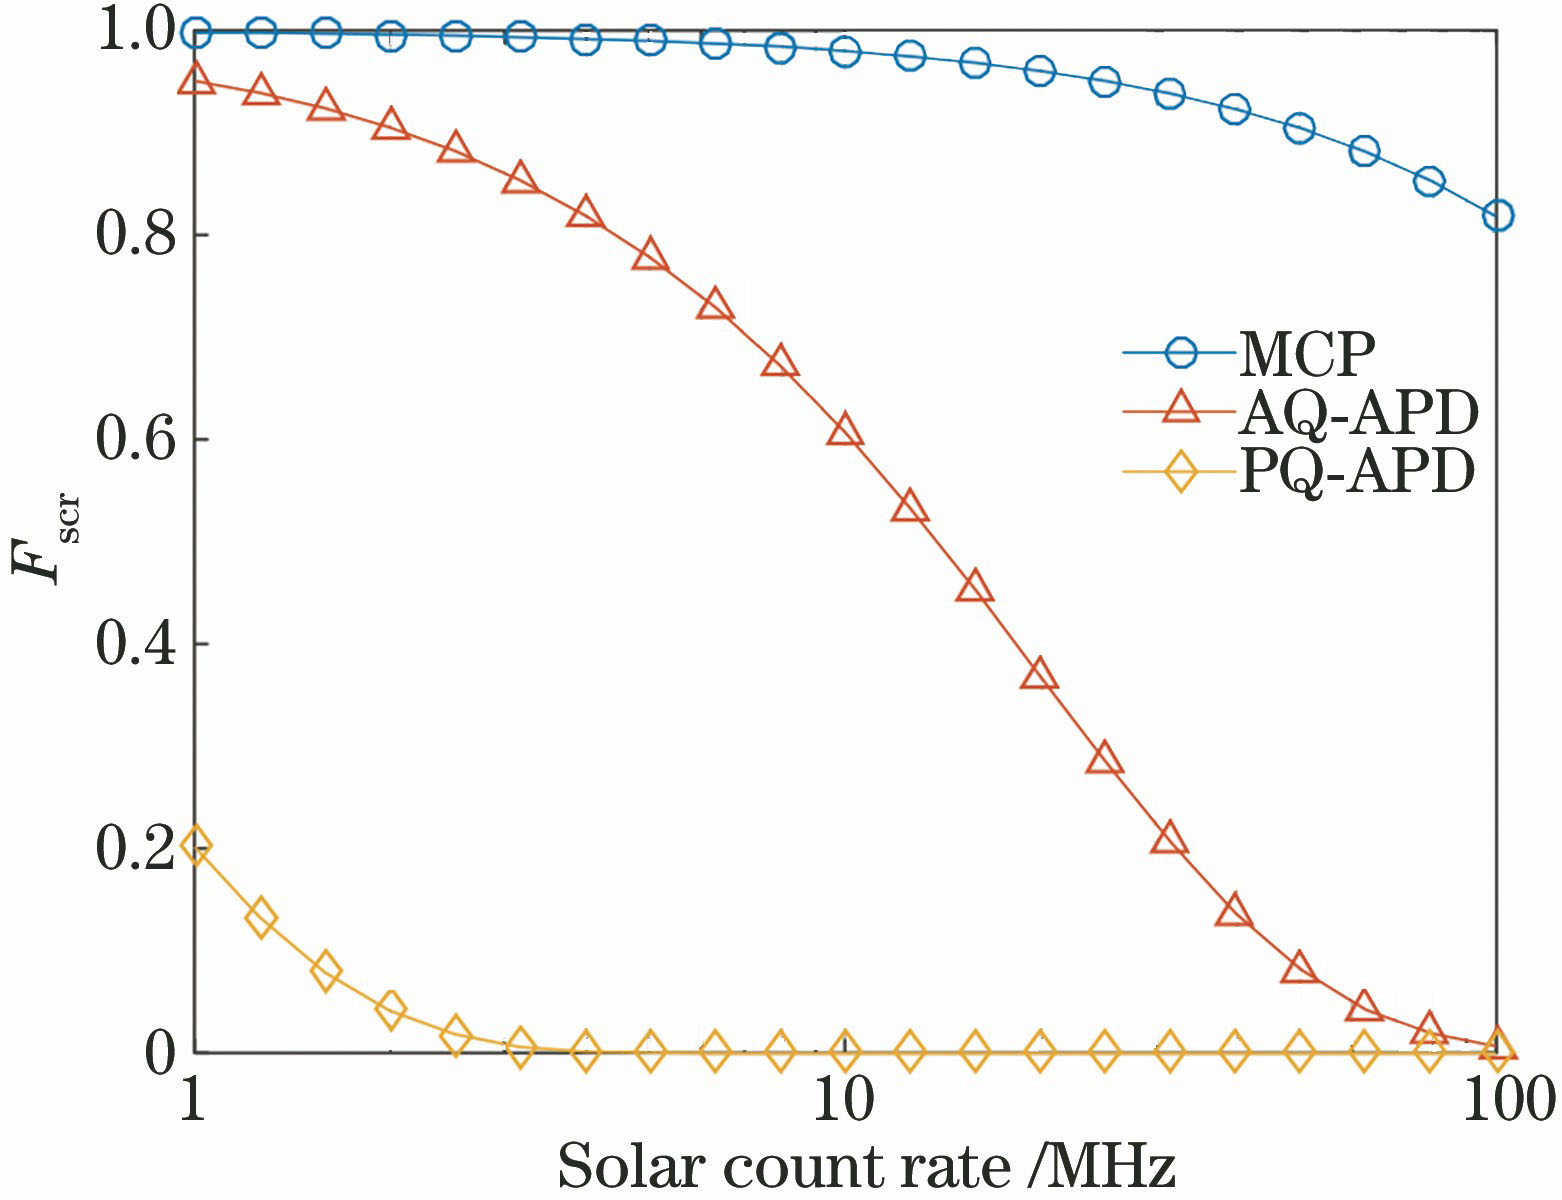
Fig. 1. Signal count reduction factor of different detectors
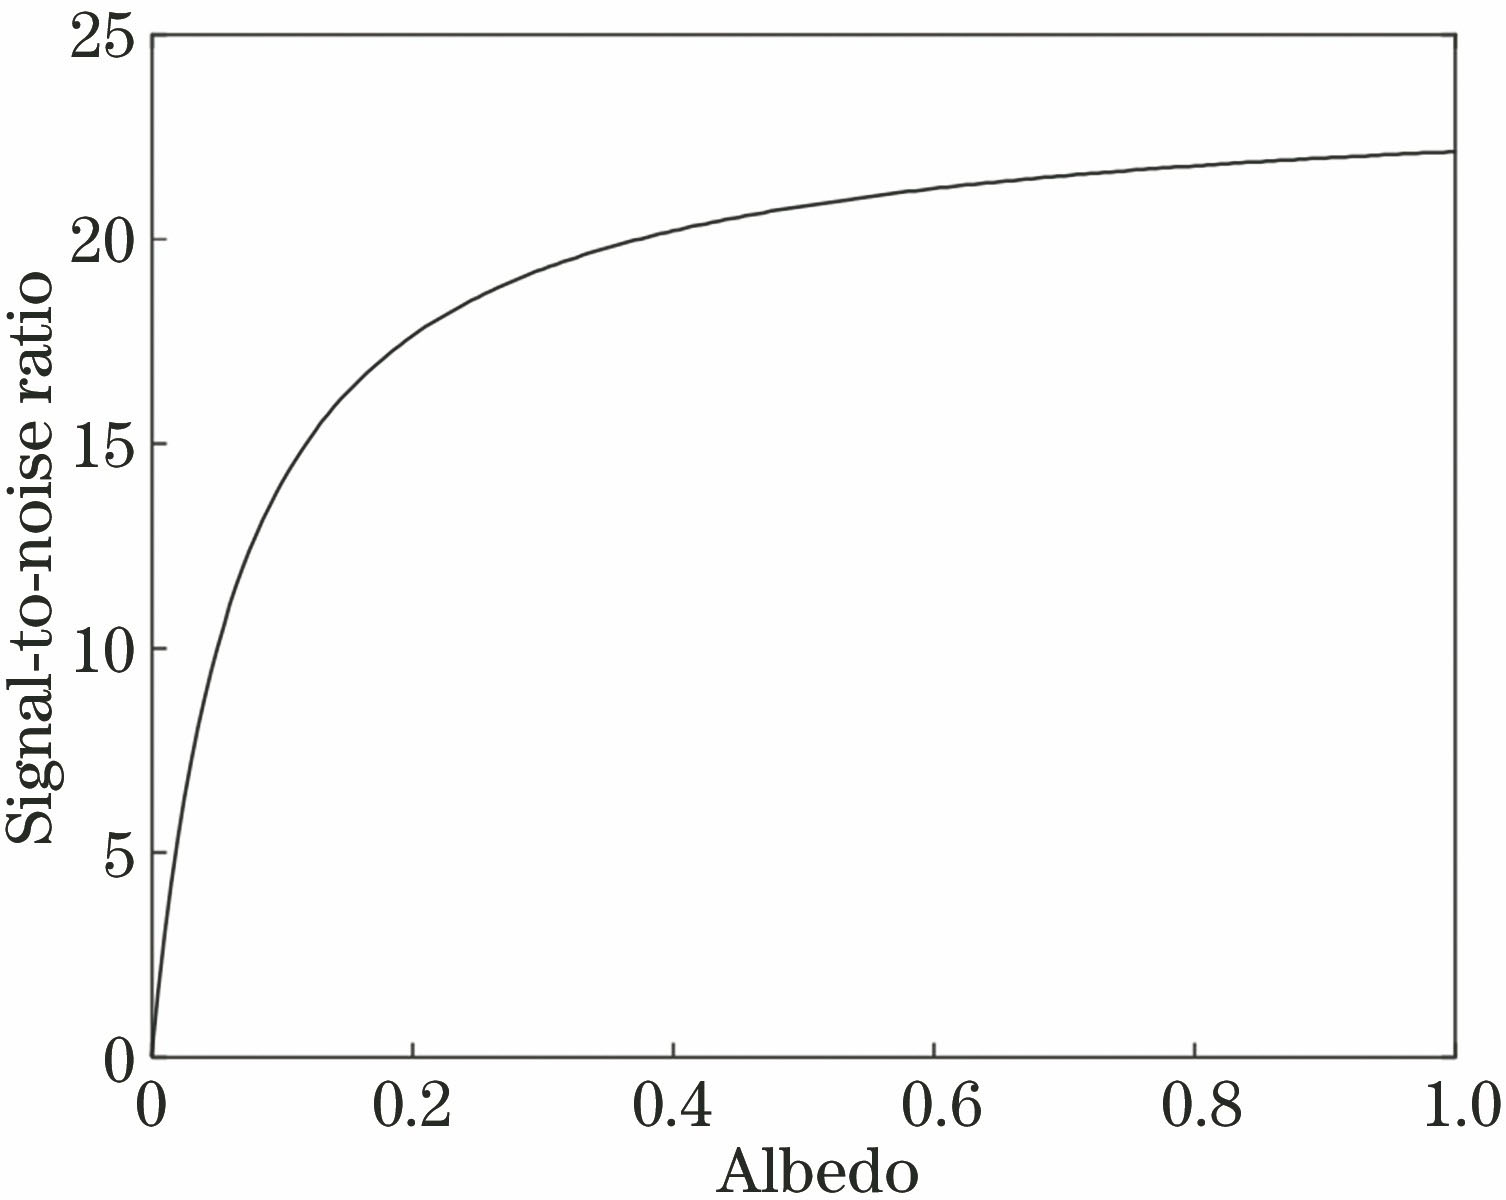
Fig. 2. Relationship between signal-to-noise ratio and albedo
Fig. 3. Echo pulse waveform
Fig. 4. Background noise distribution
Fig. 5. Probability distribution of errors at different detection rates
Fig. 6. Relationship between system error and detection rate
Fig. 7. Relationship between different parameters and detection rate. (a) Relationship between FWHM and detection rate; (b) relationship between peak detection rate and detection rate; (c) relationship between detection rate and the product of peak height and FWHM
Fig. 8. Input topography model
Fig. 9. Point clouds of event. (a) Δz=0.1 m; (b) Δz=0.2 m; (c) Δz=0.3 m; (d) Δz=0.39 m
Fig. 10. Output topography model
Fig. 11. Histogram of output topography
Fig. 12. Remote sensing image of ground object model
Fig. 13. Topography model after optimizing
Fig. 14. Topography histogram after optimizing
|
Table 1. Performance parameters of ATLAS
| |||||||||||||||||||||||||||||||
Table 2. Influence of typical atmosphere model
|
Table 3. Peak detection rate and FWHM at different detection rates

Set citation alerts for the article
Please enter your email address
© Copyright 2018-2021 | Chinese Laser Press. All Rights Reserved 沪ICP备15018463号-20