
Wan-cheng TAO, Ying ZHANG, Zi-xuan XIE, Xin-sheng WANG, Yi DONG, Ming-zheng ZHANG, Wei SU, Jia-yu LI, Fu XUAN. Intelligent Recognition of Corn Residue Cover Area by Time-Series Sentinel-2A Images[J]. Spectroscopy and Spectral Analysis, 2022, 42(6): 1948
- Spectroscopy and Spectral Analysis
- Vol. 42, Issue 6, 1948 (2022)
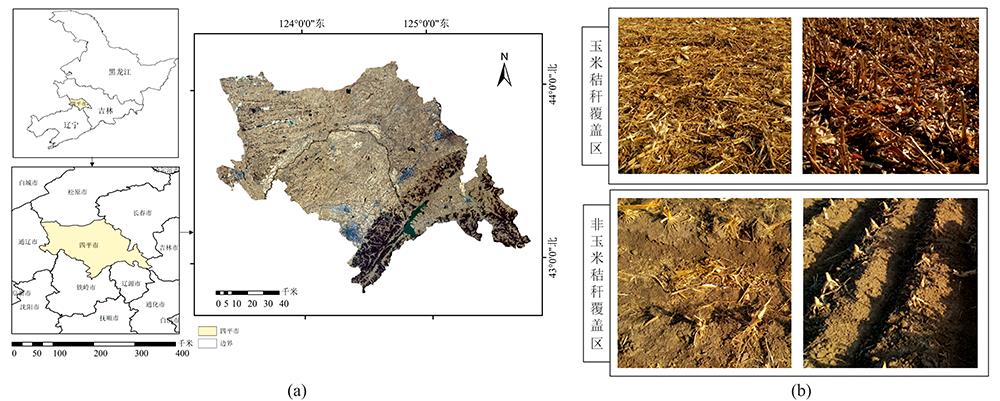
Fig. 1. Study area and Sentinel-2A acquired on November 4, 2020 (a), photos of cornresidue cover areas (b)
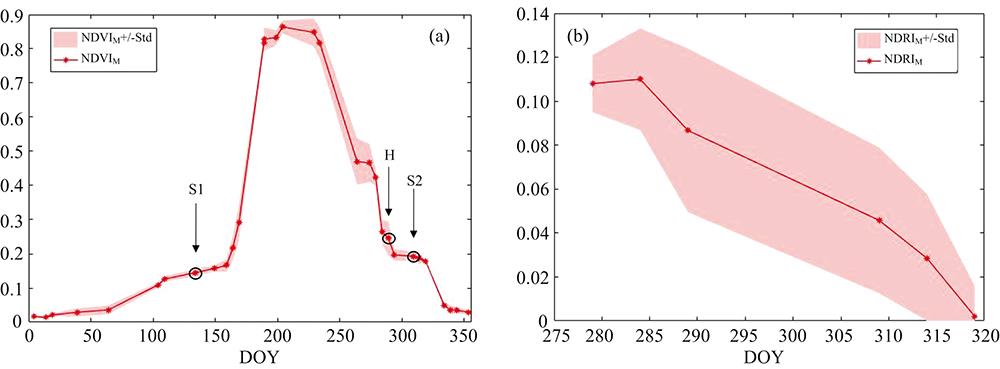
Fig. 2. Time-Sequence NDVI and NDRI change curves of corn planting areas in the study area in 2020
(a): Temporal NDVI variation curve; (b): NDRI variation curve during H-S2
(a): Temporal NDVI variation curve; (b): NDRI variation curve during H-S2
Fig. 3. Flowchart of identification technology of corn residue cover area
Fig. 4. Spectral reflectance characteristics of different ground types (Sentinel-2A images on 4 November 2020)
(a): Corn stalk residue; (b): Rice stalk residue; (c): Water; (d): Woods
(a): Corn stalk residue; (b): Rice stalk residue; (c): Water; (d): Woods
Fig. 5. Spectral reflectance characteristics of different crops (Sentinel-2A image on 22 July 2020)
(a): Corn; (b): Rice
(a): Corn; (b): Rice
Fig. 6. QT feature construction schematic diagram
(a): Blue wave heat map; (b): Single pixel time series data; (c): Time series data selection; (d): Quantile dataset
(a): Blue wave heat map; (b): Single pixel time series data; (c): Time series data selection; (d): Quantile dataset
Fig. 7. Connected domain calibration schematic diagram
(a): Numerical diagram of calssification area;(b): Schematic diagram of connected domain of pixels
(a): Numerical diagram of calssification area;(b): Schematic diagram of connected domain of pixels
Fig. 8. Visualization results of classification based on different feature dataset
(a): The original sub-image 1_w; (b): The result of M1; (c): The result of M2; (d): The result of M3; (e): The result of M4; (f): The result of M5
(a): The original sub-image 1_w; (b): The result of M1; (c): The result of M2; (d): The result of M3; (e): The result of M4; (f): The result of M5
Fig. 9. Combined with the connected domain calibration classification result 1
(a): The original sub-image 1_S; (b): The result of M5_1; (c): The result of M5; (d): The result of M6
(a): The original sub-image 1_S; (b): The result of M5_1; (c): The result of M5; (d): The result of M6
Fig. 10. Combined with the classification result of connected domain calibration 2
(a): The original sub-image 2_S; (b): The original sub-image 2_W; (c): The result of M5_1; (d): The result of M5; (e): The result of M6
(a): The original sub-image 2_S; (b): The original sub-image 2_W; (c): The result of M5_1; (d): The result of M5; (e): The result of M6
Fig. 11. Identification results of corn residuecover area
(a): The sub-image 1 of calssification result;(b): The sub-image 2 of calssification result
(a): The sub-image 1 of calssification result;(b): The sub-image 2 of calssification result
|
Table 1. Quantitative evaluation of classification models for different decision trees
|
Table 2. Classification quantitative evaluation results based on different feature dataset
|
Table 3. Quantitative evaluation results based on different time scale feature classification

Set citation alerts for the article
Please enter your email address
© Copyright 2018-2021 | Chinese Laser Press. All Rights Reserved 沪ICP备15018463号-20