
Liping Wang, Jiangkun Cao, Yao Lu, Xiaoman Li, Shanhui Xu, Qinyuan Zhang, Zhongmin Yang, Mingying Peng, "In situ instant generation of an ultrabroadband near-infrared emission center in bismuth-doped borosilicate glasses via a femtosecond laser," Photonics Res. 7, 300 (2019)
- Photonics Research
- Vol. 7, Issue 3, 300 (2019)
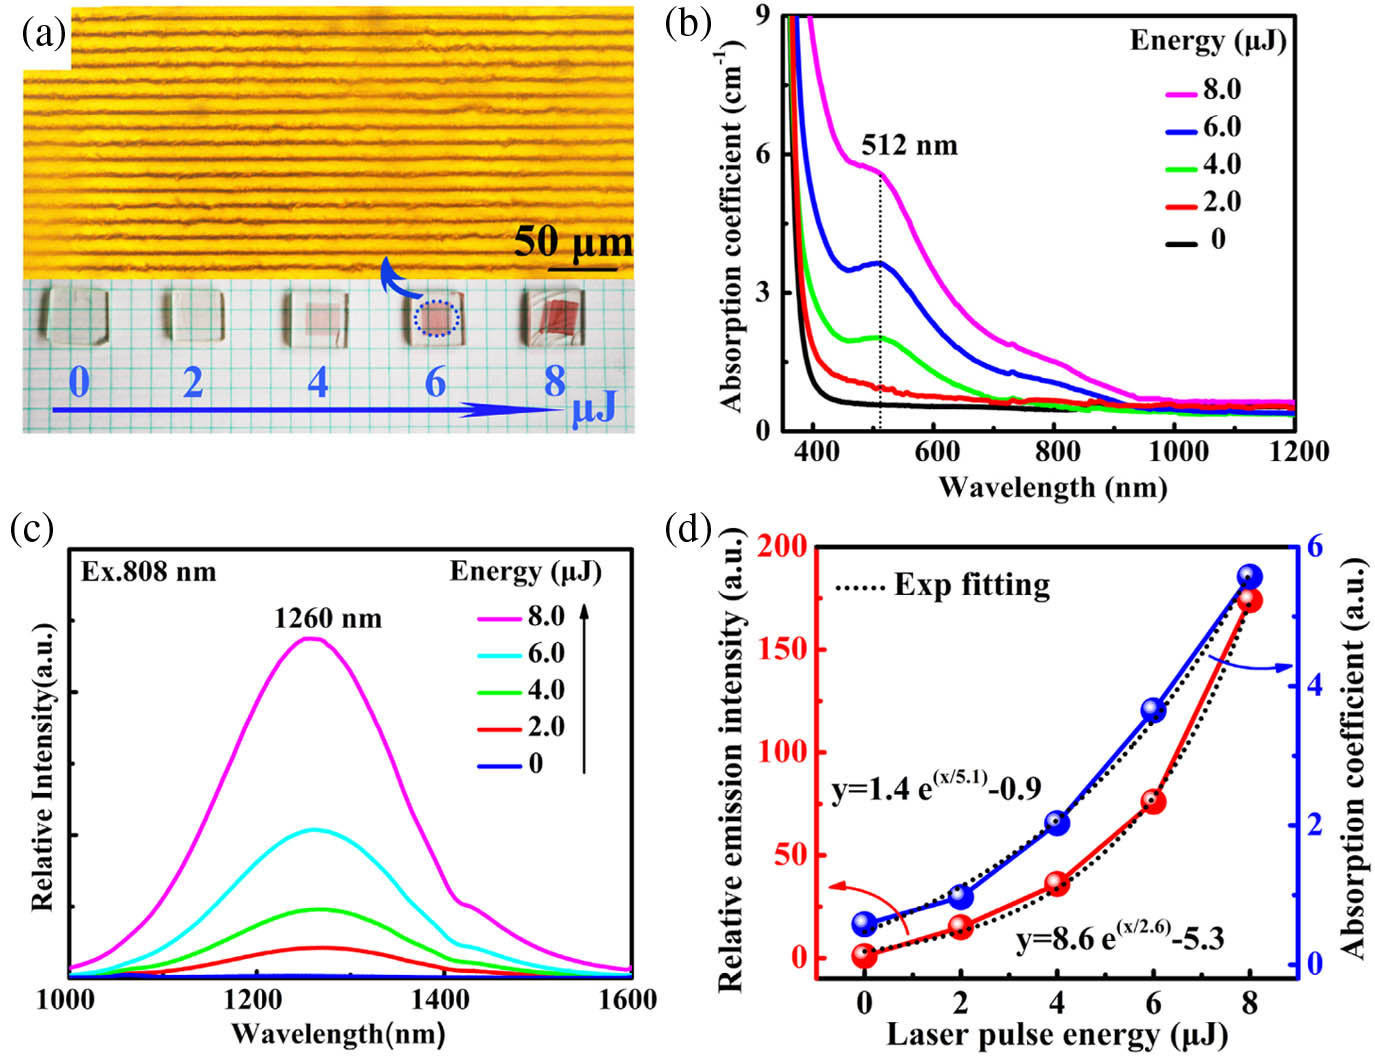
Fig. 1. Absorption and NIR emission of B0PS sample after fs laser irradiation. (a) Optical microscope image of grating under 6.0 μJ of fs laser pulse energy, and photographs of B0PS sample irradiated under different pulse energy (0–8.0 μJ, as labeled); (b) UV/VIS/NIR absorption and (c) NIR emission spectra (λ ex = 808 nm
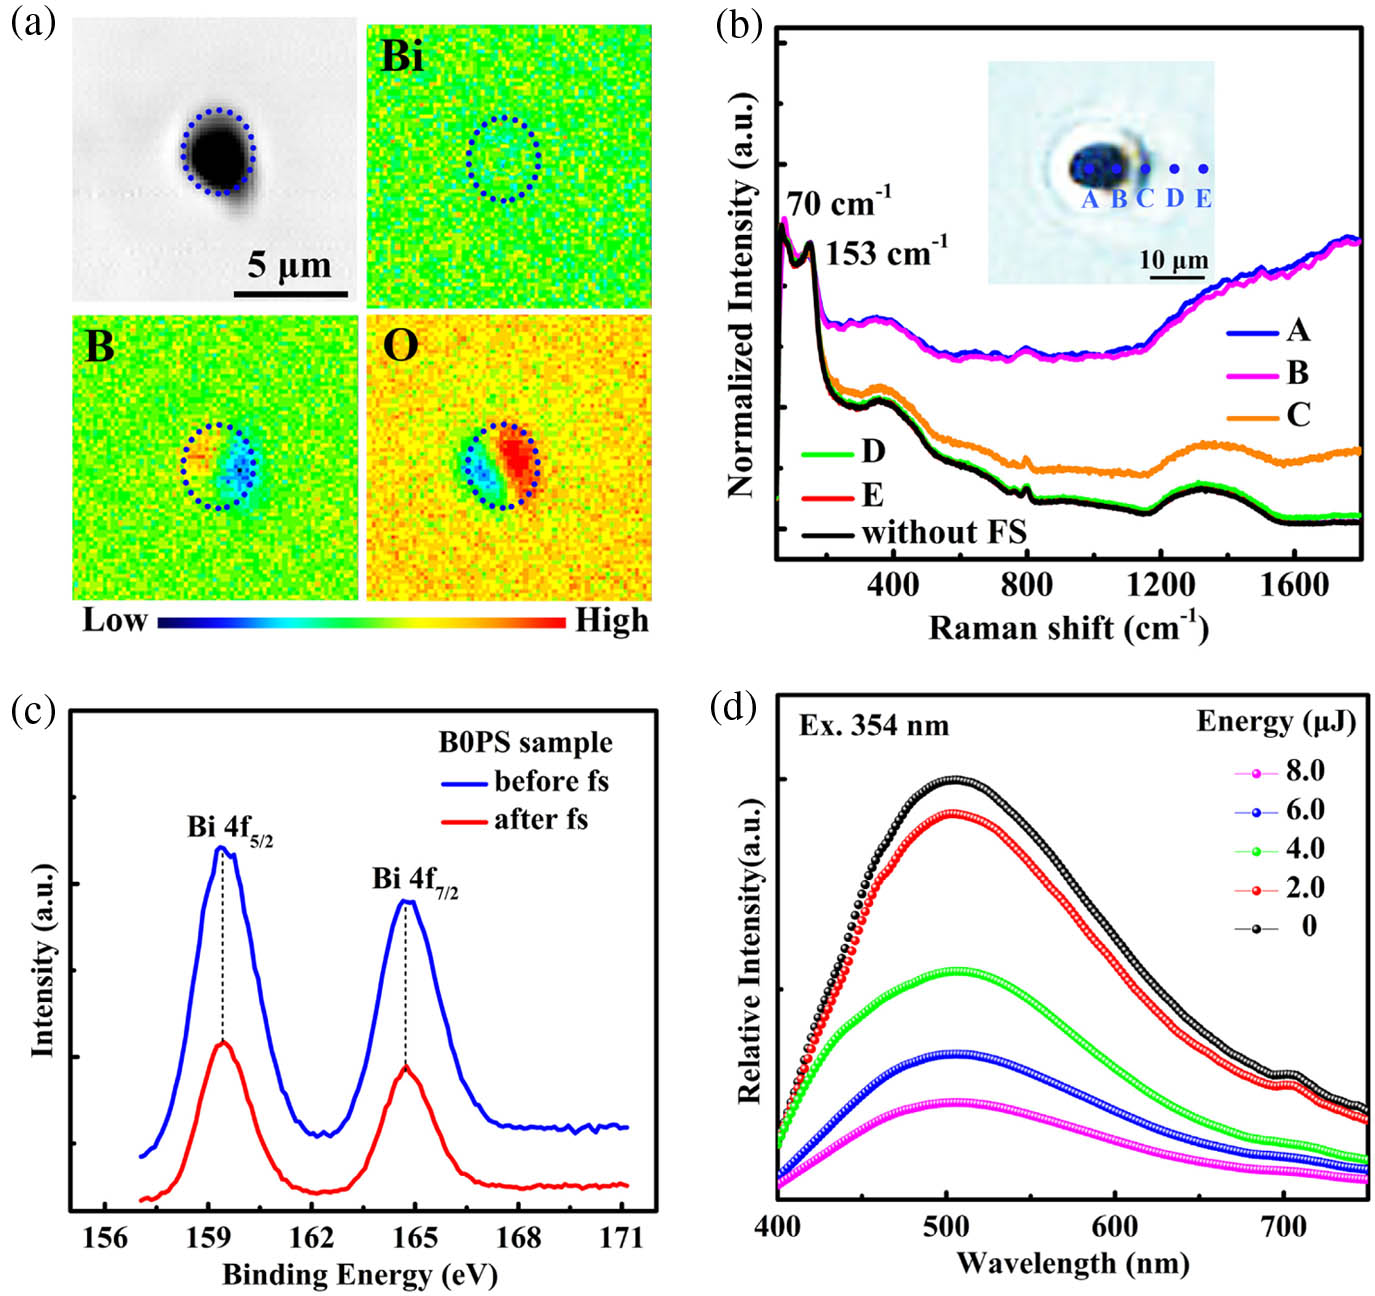
Fig. 2. Element migration, micro-Raman spectra, and visible fluorescence spectra in the fs laser-focused region. (a) Backscattering electron image and element distribution showing the relative concentrations of O, B, and Bi around the fs laser focal point; (b) micro-Raman spectra of the fs laser-focused region with different positions under 2.0 μJ of pulse energy. The Raman spectrum of the B0PS sample without fs irradiation is added for comparison (black curve). (c) XPS profiles at the Bi 4 f
Fig. 3. NIR emission and structure analysis of Bx PS glasses without fs laser irradiation. (a) Emission (λ ex = 808 nm B 11 x PS glasses (x = 0 [ BO 4 ] / [ BO 3 ] B 11
Fig. 4. Absorption, Bi NIR emission of Bx PS glasses, and the sample 60 B 2 O 3 – 15 SiO 2 – 23 PbO – 2 Sb 2 O 3 Bi 2 O 3 λ ex = 808 nm x PS (x = 0 x PS sample after fs laser irradiation. (c) The dependence of emission intensity and peak position on PbO content (x = 0 – 45 4 f B 2 O 3 – 15 SiO 2 – 23 Sb 2 O 3 Bi 2 O 3
Fig. 5. Absorption, NIR emission, and visible luminescence of the B25PS irradiated sample after annealing. (a) Absorption, (b) NIR emission (λ ex = 808 nm λ ex = 354 nm
Fig. 6. Illustration of Bi-activated optical waveguide. (a) Optical microscope image of gratings inside the B25PS sample under 6.0 μJ laser pulse energy and the diffraction pattern of an He–Ne laser at 632.8 nm; (b) Bi NIR emission when pumping the waveguide under 808 nm irradiation (3 W / cm 2


Set citation alerts for the article
Please enter your email address

© Copyright 2018-2021 | Chinese Laser Press. All Rights Reserved 沪ICP备15018463号-20