Author Affiliations
1Key Laboratory of Specialty Fiber Optics and Optical Access Networks, School of Communication & Information Engineering, Shanghai University, Shanghai 200444, China2MCC Baosteel Technology Service Co. Ltd., Shanghai 201999, Chinashow less
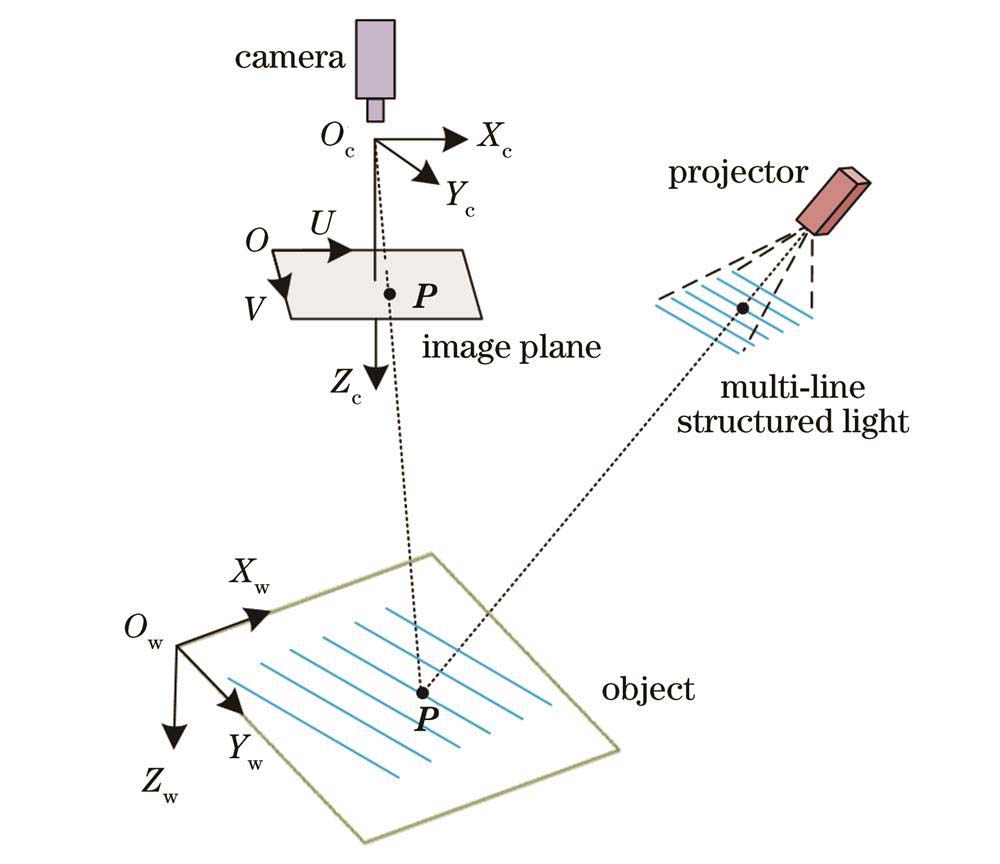
Fig. 1. Line structured light vision system
Fig. 2. Schematic diagram of horizontal ray-tracing. (a) Curved light surface; (b) camera ray plane
Fig. 3. Line structured light imaging geometry model
Fig. 4. Schematic diagram of line structured light surface grid
Fig. 5. Intersecting grid points
Fig. 6. Subpixel light strip center point
Fig. 7. Calibration system flow chart
Fig. 8. Field of line structured light surface calibration experiment
Fig. 9. Polynomial fitting results. (a) Horizontal ray-tracing; (b) vertical ray-tracing
Fig. 10. Local results of the ray-tracing grid
Fig. 11. Calibration plane reconstruction with error distribution. (a1) (a2) Proposed method; (b1) (b2) LPM; (c1) (c2) PFC
Fig. 12. Results of distance measurement
| Parameter name | Result |
|---|
| fx,fy | 3479.8270,3480.1814 | | u0,v0 | 2536.5745,2621.4617 | | k1,k2,k3 | -0.07170,0.08888,-0.02706 | | p1,p2 | 0.00114,0.00015 |
|
Table 1. Camera calibration parameters
| Method | Order of polynomial |
|---|
| 2 | 3 | 4 | 5 | 6 |
|---|
| RMSE S /mm | Horizontal ray-tracing | 8.647 | 1.841 | 1.208 | 10.754 | 30.661 | | Vertical ray-tracing | 3.304 | 0.585 | 0.395 | 0.384 | 0.527 | | Time T /s | Horizontal ray-tracing | 1.365 | 1.282 | 1.282 | 1.287 | 1.218 | | Vertical ray-tracing | 0.343 | 0.283 | 0.315 | 0.300 | 0.276 | | Number of polynomials NP | Horizontal ray-tracing | 2005 | 1955 | 1924 | 1899 | 1861 | | Vertical ray-tracing | 562 | 506 | 495 | 481 | 459 |
|
Table 2. Polynomial fitting results of different orders
| Method | Number of calibration images |
|---|
| 40 | 30 | 20 | 15 | 10 |
|---|
| Mean error E /mm | HRT | 0.764 | 0.670 | 0.587 | 0.670 | 0.582 | | VRT | 0.291 | 0.290 | 0.228 | 0.266 | 0.347 | | Proposed method | 0.678 | 0.601 | 0.524 | 0.592 | 0.548 | | Number of sample points NS | HRT | 43748 | 31932 | 20061 | 10366 | 4350 | | VRT | 9725 | 7105 | 4328 | 2490 | 739 | | Proposed method | 53473 | 39037 | 24389 | 12856 | 5089 | | Number of polynomials NP | HRT | 1924 | 1876 | 1621 | 1043 | 558 | | VRT | 495 | 466 | 402 | 265 | 100 | | Proposed method | 2419 | 2342 | 2023 | 1308 | 658 |
|
Table 3. Calibration results with different number of calibration images
| Method | Without noise | Mean value of Gaussian noise |
|---|
| 2 | 4 | 6 | 8 | 10 |
|---|
| HRT | 0.764 | 0.733 | 0.749 | 0.732 | 0.732 | 0.747 | | VRT | 0.291 | 0.265 | 0.285 | 0.265 | 0.263 | 0.284 | | Proposed method | 0.678 | 0.648 | 0.664 | 0.646 | 0.646 | 0.662 | | LPM | 0.126 | 0.125 | 0.127 | 0.125 | 0.125 | 0.127 | | PFC | 38.275 | 38.710 | 38.277 | 38.714 | 38.712 | 38.279 |
|
Table 4. Calibration accuracies of Gaussian noise with different mean values
| Method | Without noise | Standard deviation of Gaussian noise |
|---|
| 5 | 10 | 15 | 20 |
|---|
| HRT | 0.764 | 0.732 | 0.733 | 0.732 | 0.747 | | VRT | 0.291 | 0.264 | 0.264 | 0.263 | 0.284 | | Proposed method | 0.678 | 0.646 | 0.647 | 0.646 | 0.662 | | LPM | 0.126 | 0.125 | 0.125 | 0.125 | 0.127 | | PFC | 38.275 | 38.711 | 38.715 | 38.714 | 38.279 |
|
Table 5. Calibration accuracies of Gaussian noise with different standard deviations
Distance DP /mm | Method | Number of calibration images |
|---|
| 40 planer targets | 30 planer targets | 20 planer targets | 15 planer targets | 10 planer targets |
|---|
| 1294.47 | Proposed method | 0.520 | 0.518 | 0.523 | 0.638 | — | | LPM | 0.571 | 0.630 | 0.624 | 0.544 | — | | PFC | 3.768 | 9.863 | 20.815 | 50.740 | — | | 1589.78 | Proposed method | 0.835 | 0.832 | 0.897 | 0.987 | 0.820 | | LPM | 0.889 | 0.924 | 1.045 | 1.286 | 1.266 | | PFC | 34.382 | 27.744 | 35.074 | 22.608 | 25.357 | | 1693.48 | Proposed method | 0.996 | 0.993 | 0.999 | 1.023 | 0.979 | | LPM | 1.134 | 1.140 | 1.203 | 1.630 | 1.596 | | PFC | 18.589 | 6.764 | 12.296 | 16.512 | 15.035 | | 1767.24 | Proposed method | 0.959 | 1.079 | 1.065 | 1.148 | 1.016 | | LPM | 1.134 | 1.085 | 1.121 | 1.543 | 1.362 | | PFC | 6.331 | 7.973 | 4.441 | 9.263 | 7.340 |
|
Table 6. Accuracies of plate measurement
| Method | Distance to be measured |
|---|
| d1 /mm | d2 /mm | d3 /mm | d4 /mm | dH /mm | dV /mm |
|---|
| HRT | 0.017 | 1.139 | 0.177 | 0.744 | 0.030 | 0.046 | | VRT | 0.806 | 0.026 | 0.471 | 0.064 | 0.024 | 0.034 | | Proposed method | 0.399 | 0.280 | 0.340 | 0.354 | 0.028 | 0.030 | | LPM | 0.113 | 1.059 | 0.151 | 0.604 | 0.027 | 0.038 | | PFC | 3.575 | 8.501 | 6.952 | 1.001 | 0.493 | 0.202 |
|
Table 7. Accuracies of distance measurement
| Method | HRT | VRT | Proposed method | LPM | PFC |
|---|
| Length | 0.479 | 0.145 | 0.025 | 0.457 | 6.643 | | Width | 0.327 | 0.480 | 0.062 | 0.187 | 1.386 |
|
Table 8. Measurement accuracies of standard body size unit: mm