
Leonida A. Gizzi, Luca Labate, Federica Baffigi, Fernando Brandi, Giancarlo Bussolino, Lorenzo Fulgentini, Petra Köster, Daniele Palla. Overview and specifications of laser and target areas at the Intense Laser Irradiation Laboratory[J]. High Power Laser Science and Engineering, 2021, 9(2): 02000e10
- High Power Laser Science and Engineering
- Vol. 9, Issue 2, 02000e10 (2021)
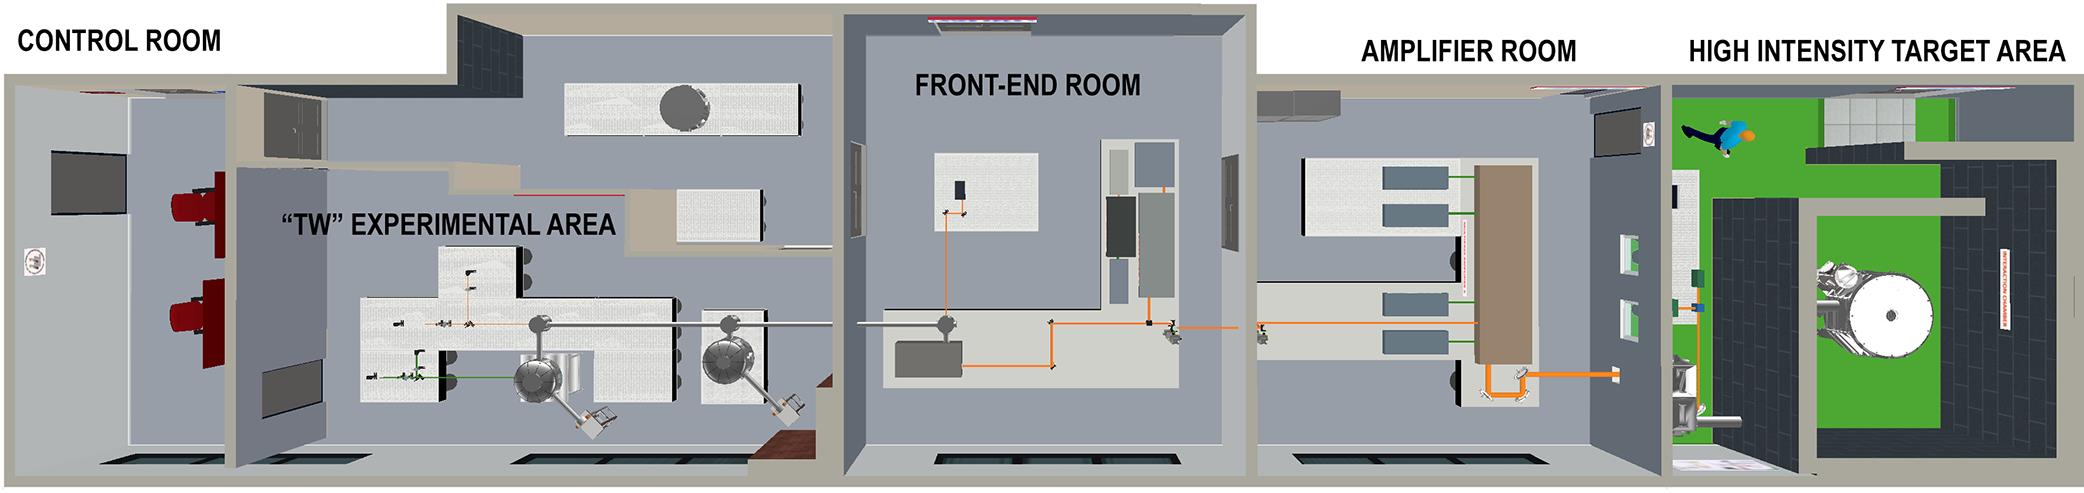
Fig. 1. Layout of the entire laboratory, including (from left) the control room, the ‘TW’ experimental area, the laser front-end room, the  220 TW amplifier room and the high-intensity target area.
220 TW amplifier room and the high-intensity target area. 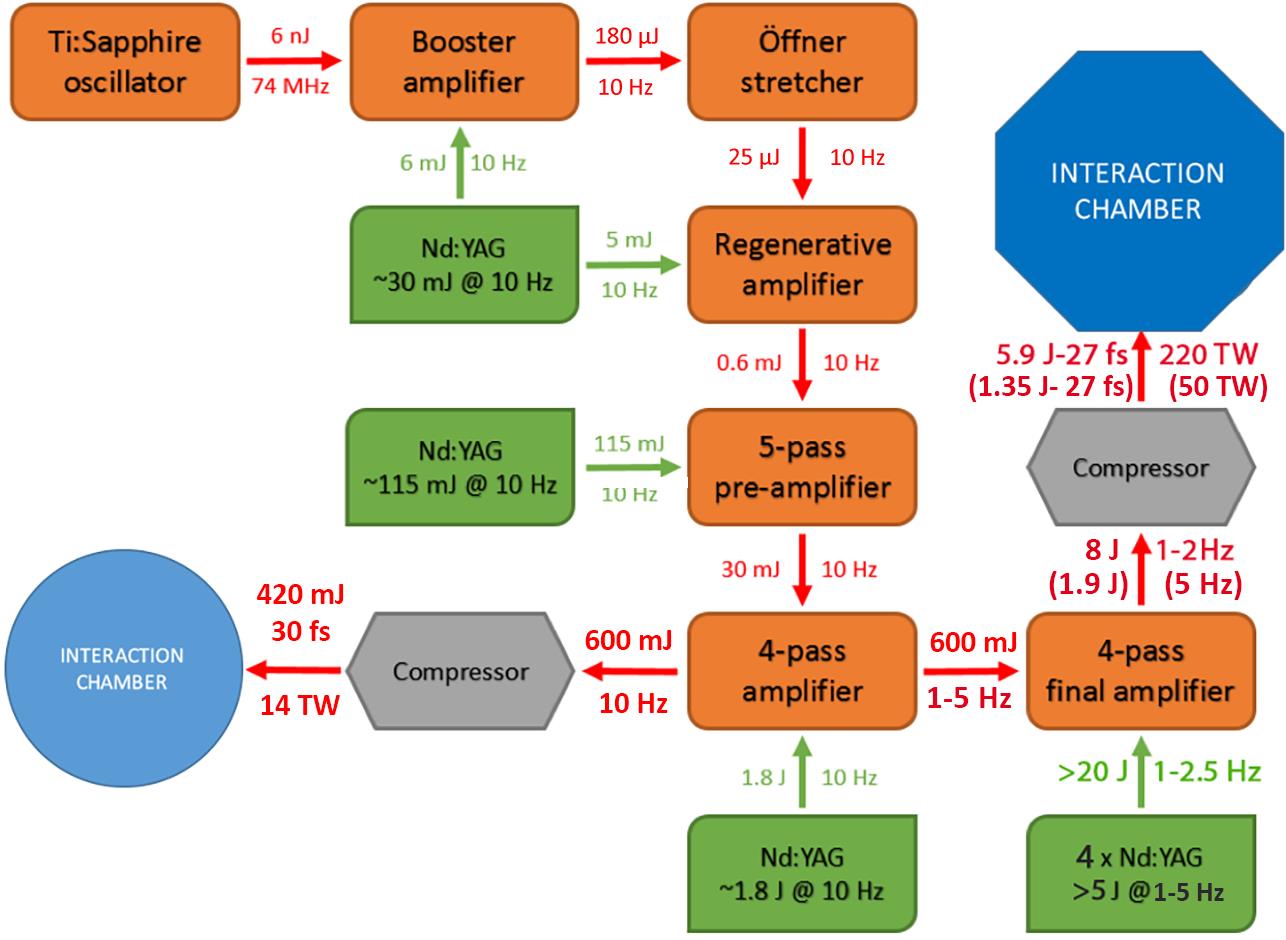
Fig. 2. Layout of the ILIL-PW laser system, showing the front-end and the power amplifiers.
Fig. 3. Pulse energy after each pass in the final amplifier as obtained by numerical simulations. The two sets of points correspond to the full-power, 1 Hz operation mode (blue points) and to the reduced power, 5 Hz operation mode (orange points).
Fig. 4. (a) 3D view and (b) side view of the compressor vacuum chamber.
Fig. 5. (a) Sample spectra of the fully amplified main pulse before entering the compressor chamber. (b) Near-field burn paper image taken before compression at 3.3 J pulse energy.
Fig. 6. (a) Microscopic image of the far field taken with the long focusing optics. (b) Profiles across the vertical and horizontal directions.
Fig. 7. Interface of the Wizzler diagnostic systems showing (top) spectral intensity and phase and (bottom) reconstructed temporal evolution of the pulse. The duration of the pulse is shown on the right.
Fig. 8. Cross-correlation curve showing the ASE contrast level of 10 and the petasecond-pedestal contrast level better than 10
 , up to 10 ps before the peak of the pulse.
and the petasecond-pedestal contrast level better than 10, up to 10 ps before the peak of the pulse. Fig. 9. Schematic layout of the target area showing the radiation shielding bunker and the beam transport from the compressor to the octagonal interaction chamber. Also shown are the two focusing configurations available as alternatives using the dedicated turning mirror. The red arrows along the beam-lines show the positions of dosimetric measurements (see Section 6 ).
Fig. 10. A view of the supporting structure of the shielding bunker.
Fig. 11. (a) Side view and (b) top view of the interaction chamber.
Fig. 12. Plot of the beam pointing stability showing the angular deflection of the centroid of the focal spot for approximately 1000 images.
|
Table 1. Available trigger signals for experiment diagnostics.

Set citation alerts for the article
Please enter your email address
© Copyright 2018-2021 | Chinese Laser Press. All Rights Reserved 沪ICP备15018463号-20